Frequently Asked Questions
Browse common questions by category, or use search to filter.
General Questions
What are Apex Instruments, Inc. hours of operation?
For your convenience, we are open Monday through Friday from 8:00 am until 5:00 p.m. (EST)
What types of payment does Apex Instruments, Inc. accept?
Apex Instruments, Inc. accepts MasterCard, Visa, American Express and wire transfer. Company purchase orders are acceptable upon credit approval.
How quickly can I receive my order?
Most stock item orders are shipped within 24 hours of receipt. Please allow extra time for custom orders. Shipping times vary according to the requested shipping service. If you have questions about your shipment please email our shipping management at shipping@apexinst.com.
How can I be approved for company credit?
To request a credit application, please fill out an Information Request Form or email accounting@apexinst.com. Please allow for processing time.
How do I request a product catalog?
For fast information, please visit our Product Area, where a full list of products is represented. Additionally, feel free to download a copy of the catalog in the Catalog page, which can be found in the Support top menu tab.
How do I find a complete list of part numbers and or kit configurations?
Apex Instruments has over 10,000 parts, we find it best to talk with our sales department to quickly help you. Please contact sales at sales@apexinst.com
Does Apex Instruments, Inc. have international distributors?
Do I need an RMA (Return Merchandise Authorization) to return items I have purchased from Apex instruments, Inc.?
Yes. Customers wishing to return items for service or credit need to contact our sales associates for an RMA. Contact support@apexinst.com / phone (919) 557-7300 or use the Contact Us form. Please allow for processing time.
Does Apex Instruments provide a product price list?
(WIP) How do I find your kit configurations?
Here is a link to our Apex Instruments Kit Configurator.
How long is an Apex Instruments quote valid? Can I make changes to my order after it’s been quoted?
Quotes from Apex Instruments are valid for 60 days. If your order is not placed within this timeframe, you will need to request a new one. If you need to update your quoted order, please contact our Sales Department, sales@apexinst.com, and an updated quote will be given to you. It would be helpful if you list the quote number in your email.
(WIP) What are the Terms and Conditions of Apex Instruments?
You may read our entire Terms and Conditions on our website here.
(WIP) Is there proof that benzoic acid is a byproduct of the degradation of XAD-2?
We do have several years of data showing that benzoic acid is a degradation product of the XAD-2 when exposed to stack gases. Please refer to the answer to [Benzoic acid, at high concentrations, has appeared in my field blanks, trip blanks, and samples using SW-846, Method 0010. Is benzoic acid real or a breakdown product of XAD-2 resin?] for an explanation of the weaknesses of XAD-2 and how to minimize background contamination of XAD-2 in your sampling program.
Other Helpful Videos & Tips
Here is a link to our Helpful Videos & Tips Playlist if you’d prefer to watch on YouTube directly.
Feel free to check out our YouTube channel as well if you cannot find the information you’re looking for in this playlist.
Where can I access EPA documents and method information?
The EPA’s documents and information are accessible via their website: www.epa.gov
Here is a list of useful EPA pages for stack testing:
US EPA Test Methods
Promulgated Test Methods: These methods have been proposed or promulgated in the Federal Register and codified in the Code of Federal Regulations (CFR).
Proposed Test Methods: Proposed test methods have been published in the Federal Register as proposed rules, but have not yet been promulgated. Proposed Federal Register Methods maybe new methods or revisions to existing FR Methods. When the method is promulgated, it becomes the official Code of Federal Regulations (CFR) Method.
Approved Alternative Methods: These methods may be used by sources for determining compliance with the requirements of these Parts per their specified applicability provisions without further EPA approval. The Administrator, or designee has approved these methods for the specified applications; this approval has been documented through an official EPA letter. These methods include quality control and quality assurance procedures that must be met. The EPA staff may not necessarily be the technical experts on these methods.
Conditional Test Methods: This category includes methods that were categorized as conditional test methods before our method categories were revised. Because some of these methods have been cited in state rules and permits under their Conditional Test Method (CTM) designation, we have created a category for them and called it ΓÇ£Historic Conditional MethodsΓÇ¥. This category is closed and no new methods will be added to it.
Other Test Methods: This category includes test methods which have not yet been subject to the Federal rulemaking process. Each of these methods, as well as the available technical documentation supporting them, have been reviewed by the Emission Measurement Center staff and have been found to be potentially useful to the emission measurement community.
Monitoring:
Promulgated and Proposed Performance Specifications: Performance specifications are used for evaluating the acceptability of the Continuous Emission Monitoring System (CEMS) at the time of or soon after installation and whenever specified in the regulations.
Quality Assurance Procedures: Quality assurance procedures in Appendix F to 40 CFR 60 are used to evaluate the effectiveness of quality control (QC) and quality assurance (QA) procedures and the quality of data produced by any Continuous Emission Monitoring System (CEMS) that is used for determining compliance with the emission standards on a continuous basis as specified in the applicable regulation.
Compliance Assurance Monitoring: The Compliance Assurance Monitoring, or CAM, rule is designed to satisfy the requirements for monitoring and compliance certification in the Part 70 operating permits program and Title VII of the 1990 Clean Air Act Amendments. The CAM rule includes a new Part 64 and associated revisions to the Part 70 (permits program) monitoring and compliance certification requirements. The rule would establish criteria that define the monitoring, reporting, and record keeping that should be conducted by a source to provide a reasonable assurance of compliance with emission limitations and standards. These criteria address defining the applicable monitoring approach, obligation to complete corrective actions as indicated by the monitoring results, and how such data are used in the annual compliance certification.
Continuous Emission Monitoring: A continuous emission monitoring system (CEMS) is the total equipment necessary for the determination of a gas or particulate matter concentration or emission rate using pollutant analyzer measurements and a conversion equation, graph, or computer program to produce results in units of the applicable emission limitation or standard.
Metals and Mercury Emissions Monitoring
EPA Technical Support
Technical Support for Quality Assurance
EPA Instructional Material
Technical Information Documents
Workshop and Meeting Materials
EPA Volume III PDF Documents
Users are cautioned that neither of these documents have been updated since they were published and that many of the test methods have been revised and program responsibilities changed. Users are also advised that while these documents present procedures and information that are reflective of good practice, the guidance provided in these documents has no legal standing unless the CFR specifically requires the tester to follow Volume III.
What is Method 7C/7D?
Method 7C (Colorimetric) and 7D (Ion Chromatography) are used for the determination of nitrogen oxide emissions.
A sample is passed through a series of specially built impinger that contains an alkaline potassium permanganate solution. The impingers are of standard height with a narrow bottle, which improves the collection efficiency. The sample rate is between 400 and 500 cubic centimeters per minute. Normally, three one-hour samples are collected for the test.
For 7C, an integrated gas sample is extracted from the stack and passed through impingers containing an alkaline potassium permanganate solution; NOX (NO + NO2) emissions are oxidized to NO2 and NO3. Then NO3− is reduced to NO2− with cadmium, and the NO2− is analyzed colorimetrically.
For 7D, an integrated gas sample is extracted from the stack and passed through impingers containing an alkaline-potassium permanganate solution; NOX (NO + NO2) emissions are oxidized to NO3−. Then NO3− is analyzed by ion chromatography.
For more information and documents about Method 7C, please consult the EPA’s Method 7C webpage. For more information and documents about Method 7D, please consult the EPA’s Method 7D webpage.
Apex Instruments offers a Method 7C/7D Sampling System. If interested in Method 7C/7D sampling, Apex Instruments works with our customers to make sure we are providing the correct products for your project and will provide you with a price quote. For any questions about our sampling system, please contact sales@apexinst.com.
Can You Give A Brief History Of Stack Testing?
Emission inventories have long been recognized as a cornerstone of air quality management. Emission inventories are required in order to establish the sources, determine their relative ΓÇÿinsultsΓÇÖ on the ambient air quality and to develop mitigation strategies for the reduction and management of these emissions, among other things. Without a clear realization of the importance, the strengths and limitations of this tool, it is difficult to make intelligent decisions on the overall air quality strategies to be employed.
The early days of formalized federal actions on air quality were delegated to and carried out by the U.S. PHS. The Taft Sanitary Engineering Center in Cincinnati, Ohio had become known for its work in water quality and establishment of water standards, especially in the late 1950ΓÇÖs and early 1960ΓÇÖs. Thus, the Center was an obvious place to give birth to federal studies and other activities related to air quality. This aspect grew through the mid 60ΓÇÖs and continued as the focal point of such activities within its Division of Air Pollution, Bureau of Abatement and Control (direct predecessor of todayΓÇÖs EPA Office of Air Quality Planning and Standards/OAQPS). That office was moved to Durham, then to Research Triangle Park, North Carolina beginning in 1967.
While still in Cincinnati, the Bureau developed studies to determine how to measure and control air pollution, studied health effects, developed model emission reduction programs, public education efforts, Interstate Abatement (enforcement) actions, 4 and carried out a general charge to analyze the problems and find solutions, even though the levels of authority and controls were rather limited, except where interstate commerce and transport of air pollution was an issue. The interstate actions and processes developed to implement those actions resulted in major contributions to fundamental approaches still utilized today. Many of the pioneers of the ΓÇ£scienceΓÇ¥ and processes or procedures we follow today were employed under these efforts. Many of these were hired from (where else but) the South Coast Air District of California.
One of the major chores of this group of officers and civil servants was to establish techniques, measures, demonstrations and other means to put some handles on this ΓÇ£air pollution beast,ΓÇ¥ and thus ultimately protect the health of the public. One aspect observed was the need to establish a means to measure both ambient air quality and emissions and to develop management processes to develop and implement standards to this purpose. One such aspect was the recognition of the need to somehow quantify or estimate emissions.
The Clean Air Act was enacted in 1963 to protect the quality of the nation’s air resources. It initiated research and development programs to monitor and control pollutants emitted to the atmosphere. Emissions from stationary sources are monitored under the statutes of the act.
The Clean Air Act, with its various amendments through 1990, has produced more and more programs that demand increasing ΓÇ£exactnessΓÇ¥ in quantification of emissions. The basic emission inventory of the 1970-era represented knowingly ΓÇ£grossΓÇ¥ emissions in a jurisdiction in an effort to define the relative impact of facilities, one to another. This provided a basis and rational way to develop program(s) and efforts that would result in reductions in the appropriate groupings of facilities, for the correct pollutants and with an approximate fairness of application of the ΓÇ£painΓÇ¥ and economics of the resulting emission controls. As air quality management has evolved and become more refined, modeling has become extremely important and critical to the precision and ΓÇ£dependabilityΓÇ¥ of the results. The 1990 Amendments brought new levels of ΓÇ£expectationΓÇ¥
for additional uses such as assessment of emission fees, emission trading programs and other such applications.
A young Public Health Service engineer officer named Robert (Bob) Dupree took on the ΓÇ£awesome taskΓÇ¥ of making a broad compilation of emission estimation information and emission factors that could be used by states and by the PHS in the interstate abatement actions and other studies that were a primary focus of the organization. He compiled all such information that he could get his hands on, including the preceding documents, field notes and guesses, quotes of individuals who were experimenting, and other profound and inspired information. Thus, (the First Edition of) ΓÇ£A Compilation of Air Pollutant Emission FactorsΓÇ¥ (better known perhaps as AP-427 ) was published in 1968. This document continues today.
In later years, from the late 70ΓÇÖs and thereafter, many efforts have been made to more precisely assess the errors in emissions from inventories.
There are many variables that can make a difference in the generation and estimation of emissions. Factors such as design, maintenance, temperatures, control device selection and design, fuels, synergistic combinations of minor constituents of fuels, etc. can cause two fold and even 10-fold or more variation in emissions measured. Even measured data are often suspect and subject to errors and concerns regarding validity, so how can emission estimates using average conditions as applied to another facility be any less of concern? The test method and procedures and the manner the data are reported are definitely important to the interpretation and use of the data.
It was impractical (or impossible) to put the same high volume air sampler into a stack and orient it in such a way to provide any meaningful relationship between stack emission measurements and those measured in the ambient air. Thus, the technical community came up with other ways to attempt to quantify the emissions from an emission source or stack. The method that gained acceptance for total particulate with the implication of being compatible with the emission standard, and perhaps ambient data, became known as Method 5.
What Are The Health Impacts Of Air Pollution?
Ozone is a gas composed of molecules with three oxygen atoms. (The oxygen we need for life is made up of molecules with two oxygen atoms). Ozone forms in the lower atmosphere when a combination of other pollutants, usually nitrogen oxides (NOx) and volatile organic compounds (VOCs), ΓÇ£cookΓÇ¥ together in sunlight through a series of chemical reactions. NOx and VOCs are produced primarily when fossil fuels such as gasoline, diesel, oil, natural gas or coal are burned or when solvents and some other chemicals evaporate. NOx is emitted from power plants, motor vehicles and other sources of high-heat combustion. VOCs are emitted from motor vehicles, oil and gas operations, chemical plants, refineries, factories, gas stations, paint and other sources.
Climate change – higher temperatures increasing ozone production. Because the reactions take place in the atmosphere, ozone often shows up downwind of the sources of the original emissions, sometimes many miles from where it formed.
Ozone air pollution is sometimes called ground-level ozone.
Factories, power plants, and diesel- and gasoline-powered motor vehicles (cars and trucks) and equipment either directly emit fine particles or generate the precursors such as nitrogen oxides (NOx) that can form into fine particles in the atmosphere. Other sources include wildfires and burning wood in wood stoves or residential fireplaces.
Many particles are so small as to be invisible, but when pollution levels are high, the air can appear thick and hazy.
Ozone gas is a powerful lung irritant. When it is inhaled into the lungs, it reacts with the delicate lining of the airways, causing inflammation and other damage that can impact multiple body systems. Ozone exposure can also shorten lives.
The damage ozone does to the body can be deadly. Recent research has affirmed earlier findings that short-term exposure to ozone, even at levels below the current standard, likely increases the risk of premature death, particularly for older adults. There is also a growing body of evidence that long-term exposures to ambient ozone may be associated with an increased risk of cardiovascular and respiratory disease mortality.
Researchers estimate that PM2.5 (fine particulates) is responsible for nearly 48,000 premature deaths in the United States every year.
Ozone has a serious effect on the respiratory system, both in the short-term and over the course of years of exposure. When ozone levels are high, many people experience breathing problems such as chest tightness, coughing and shortness of breath, often within hours of exposure. Even healthy young adults may experience respiratory symptoms and decreased lung function.
Other breathing problems that have been tied to short-term exposure to ozone include:
ΓùÅ Worsening of symptoms, increased medication use, and increased emergency department visits and hospital admissions for people with asthma and COPD;
ΓùÅ Susceptibility to respiratory infections such as pneumonia, resulting in an increased likelihood of emergency department visits and hospitalizations.
Living with ozone pollution long-term may cause lasting damage to respiratory health, including:
ΓùÅ Development of new cases of asthma in children;
ΓùÅ Damage to the airways, leading to development of COPD;
ΓùÅ Increased allergic response.
The inflammation and systemic stress caused by short- and long-term exposure to ozone can also do damage to tissues, DNA and proteins throughout the body, which can cause or worsen other disease conditions over time. These include:
ΓùÅ Increased risk of metabolic disorders, including glucose intolerance, hyperglycemia and diabetes;
ΓùÅ Impact on the central nervous system, including brain inflammation, structural changes and possible increased risk of cognitive decline;
ΓùÅ Increased likelihood of reproductive and developmental harm, including reduced fertility, preterm birth, stillbirth and low birth weight;
ΓùÅ Possible cardiovascular effects ΓÇô although according to the most recent EPA review, the evidence linking ozone to heart disease, heart failure and stroke is mixed.
Health Equity: Research has shown that people of color are more likely to be exposed to air pollution and more likely to suffer harm to their health from air pollution than white people.49, 50 Much of this inequity can be traced to the long history of systemic racism in the United States. Discriminatory practices such as redlining, the systematic outlining of riskier neighborhoods by mortgage lenders, institutionalized residential segregation in the 20th century, impairing the ability of many people of color to build wealth and limiting their mobility and political power. Over the years, decision-makers have found it easier to place sources of pollution, such as power plants, industrial facilities, landfills and highways in economically disadvantaged communities of color than in more affluent, whiter neighborhoods. The resulting disproportionate exposure to air pollution has contributed to high rates of emergency department visits for asthma and other diseases.
Children, seniors, underlying health conditions and people living in poverty are also at risk.
From APTI 450 Course Manual
Stack Testing Questions
Where Can I Find a Copy of SW-846?
Hard copy
National Technical Information Service (NTIS)
5285 Port Royal Road, Springfield, VA, 22161
Ph: (703) 487-4650
Fax: (703) 321-8547
E-mail: Info@NTIS.FEDWORLD.GOV
Website: https://www.ntis.gov.
Electronic copy
Could You Please Explain the Difference Between Isokinetic and Anisokinetic Sampling?
Isokinetic sampling conditions exist when the velocity of the particles and gases entering the probe nozzle tip (Vn) is exactly equal to the velocity of the stack gases (Vs), that Vn = Vs. Percentage isokinetic is then calculated:
Percent isokinetic (% I) = Vs/Vn X 100
When Vn does not equal Vs, we have anisokinetic conditions where sample concentrations can be biased because of the inertial effects of particles in the gas stream. The particle composition and sizes in the gas stream affect how much there will be on the final pollutant mass rate (PMR) from the facility. In general, the following conditions exist in a stack gas stream:
- Small particles (< 1 micron) tend to follow the stream lines of the gas stream. If the source is composed of only small particles, then there is little effect on whether you sample above or below isokinetics, thus little effect on the PMR.
- Large particles (> 5 microns) tend to move in their own initial direction. For under isokinetic sampling (the nozzle is bringing in gas at too low a rate), the gas stream ΓÇ£bunches upΓÇ¥ at the nozzle inlet. The large particles tend to ΓÇ£punch throughΓÇ¥ the ΓÇ£stream linesΓÇ¥ (due to their own inertia) and into the nozzle area (they should have gone around the nozzle), thus biasing the PMR and giving results more associated with a lower sample volume. Consequently, there are too many large particles for the small volume sampled. For over isokinetic sampling (the nozzle inlet velocity is greater than the passing gas stream velocity), the nozzle brings in gas not directly in front of it. The large particles, due to their inertia, do not follow the stream lines and continue in the same direction. Thus, the nozzle samples a non-representativeness of large particles in the gas stream, but for twice the volume of gas sampled through the nozzle (the larger particles enter the nozzle as if 100 % isokinetic sampling was occurring). The small particles enter the nozzle outside the effective area of the nozzle (the small particles follow the bent stream lines into the nozzle). Consequently, with the combination of the effects of the large and small particles, the PMR increases.
- Intermediate particles are somewhat deflected for the stream lines of the gas stream.
We use this information in determining if you should reject or accept the stack test if the percent isokinetics are outside the 90-110 % limits and the source PMR were within their limits. If the source test report shows that the percent isokinetics was under 90 % and majority of the particles were < 1 micron in size, then the test should be accepted since fine particles affect PMR very slightly. In the same manner, if the particles are > 5 microns and the percent isokinetics are less than 90 %, then the test should be definitely accepted since the results are bias high due to large particles (more large particles for a smaller sample volume). Therefore, accept the results even if the isokinetics were below 90 %
Now, if the PMR is above the emission limit and we have < 90 % isokinetics, one can multiply the PMR by the factor % I/100 and recalculate the PMR. If this adjusted PMR is still higher than the standard, then the test is accepted even with the percent isokinetic over 110 (the results are in favor of the EPA). On the other hand, if the adjusted PMR is lower than the standard (thus bringing them into compliance), then reject the test and require a retest to be performed.
If the PMR is above the emission limit and the % I is above 110 %, then the test should be accepted because the PMR is equal to the true value or bias low relative to it; thus, the PMR is over the standard. If PMR is below the standard and the % I is above 110 %, then perform the same correction as above to the PMR (multiply by % I/100), and if it is still below the emission limit, the test should be accepted. The PMR meets the standard even though the maximum adjustment (biases due to large particles) has been made. On the other hand, if the adjusted PMR exceeds the standard, you can accept the test results even though they did not meet the 90-110 % I because they still exceed the standard.
(WIP) Where Do I Go to Get References to Title III Hazardous Air Pollutants (HAPs), Their Boiling Points, and Vapor Pressure?
Γ¥ùDuring the presentation on Defining Hazardous Air Pollutants (HAPs), we discussed the methodology EPA uses to define the Clean Air Act Amendments of 1990, Title III, HAPs by boiling point (BP) and vapor pressure (vp). <– Either provide this presentation or reword/remove thisΓ¥ù
The EPA uses eight categories to define HAPs according to vapor pressure:
- Very Volatile Organic Compounds [VVOC] (vp> 380 mm Hg)
- Very Volatile Inorganic Compounds [VVINC] (vp> 380 mm Hg)
- Volatile Organic Compounds [VOC] (vp 0.1 to 380 mm Hg)
- Volatile Inorganics [VINC] (vp 0.1 to 380 mm Hg)
- Semi-volatile Organics [SVOC] (vp 10-1 to 10-7 mm Hg)
- Semi-volatile Inorganics [SVINC] (vp 10-1 to 10-7 mm Hg)
- Non-volatile Organics [NVOC] (vp < 10-7 mm Hg)
- Non-volatile Inorganics [NVINC] (vp < 10-7 mm Hg)
Using boiling points, the EPA defines HAPs by three broad categories:
- Volatiles (VVOC/VVINC/VOC/VINC) BP < 100 C
- Semi-volatiles (SVOC/SVINC) BP 100 to 300 C
- Particles (NVOC/NVINC) BP > 300 C
We use this information to help us pick the proper sampling train to capture our analytes. Particles would use a filtration technique, semi-volatiles would use both filtration and adsorbent, and volatiles would a combination of adsorbents in the sample train.
Γ¥ùYou were provided a copy of the paper written by Larry Johnson and myself that included the listing of the CAAA of 1990 Title III HAPs and appropriate sampling methods from EPAΓÇÖs SW-846 Compendium for each of the listed HAPs. <– The document in question needs to be provided and this section reworded, or removed.Γ¥ù
Regarding the availability of documents that list the BP and vp for the Title III HAPs, the EPA has funded three documents which have as part of them BP and vp for the Title III HAPs. They are:
- Ambient Measurement Methods and Properties of the 189 Clean Air Act Hazardous Air Pollutants (HAPs), EPA-600/R-94/187, October 1994. (EPA Project Officer: Bill McClenny, 919-541-3158).
- Simultaneous Control of PM-10 and Hazardous Air Pollutants II: Rationale For Selection of Hazardous Air Pollutants as Potential Particulate Matter, EPA-452/R-93/013, October 1992 (EPA Project Officer: Gary Blais, 919-541-3223).
- Screening Methods for the Development of Air Toxics Emission Factors, EPA-450/4-91-021, September 1991 (EPA Project Officer: Bill Kuykendal, 919-541-5372).
To obtain copies of these documents, you can order from EPAΓÇÖs National Technical Information Service (NTIS), 5285 Port Royal Road, Springfield, VA, 22161, (703-487-4650, email: Info@NTIS.FEDWORLD.GOV, Internet: https://www.ntis.gov.
Γ¥ùAdditionally, you may call each of the EPA Project Officers and have them send you a copy. You may need to be persistent in your demands for a copy.
In addition, you can find the chemical and physical properties (i.e., vapor pressures and boiling points) for many HAPs online. A useful site is: https://chemfinder.camsoft.com <– Is this still true/recommended? This website doesn’t exist anymore or was changed.Γ¥ù
How Do You Take a Reading For Delta p and Delta h When The Meniscus Line Is Not Horizontal To The Manometer Tube?
When reading a meniscus, the analyst must be very careful that no error is introduced into the reading due to parallax. Under normal conditions, the chemist reads the meniscus on a horizontal ΓÇ£line-of-sightΓÇ¥ at the bottom of the crescent-shaped body from the concave wetting of the liquid on the walls of the container (convex if it does not, i.e. mercury in a glass tube). Remember, the error associated with 0.1 in. water in reading the delta p was 2.4 % associated with the mass emission rate. One can read the incline manometers on the Method 5 sample box to within 0.05 in. water. Therefore, the error would only be very slight to the other possible errors in recording data and the operation of the sample train. This is also true for reading the delta h. When reading the delta h or delta p in the field, keep your ΓÇ£line-of-sightΓÇ¥ horizontal and read the ΓÇ£bottomΓÇ¥ of the crescent-shape of the meniscus.
(WIP) You Mentioned MACT Standards and EPAΓÇÖs Timeline. Can You Further Explain the MACT Bins?
In Lecture 2, Regulations, we discussed EPAΓÇÖs progress associated with the implementation of the MACT standards, which contain sampling and analytical guidance on quantifying emissions covered by the standard. In December, 1997, EPA submitted a report to Congress entitled: Second Report to Congress on the Status of the Hazardous Air Pollutant Program under the Clean Air Act. According to the report, EPA has fulfilled the 2- and 4-year groups (bins) for approximately 25 % of the 173 listed source categories in the Clean Air Act Amendments of 1990. The Agency is, however, falling behind on promulgating standards for the 7- and 10-year groups. Twenty-nine (29) new standards were to be originally due in 1997, but will now be promulgated in 1998. With each of these standards, test methods must be identified for compliance purposes.
One of the interesting areas that is still under discussion is whether residual risk (10 -6) issues will apply once the MACT standard is in place for a source category. As you recall in our presentation, we discussed the the requirements in the CAAA of 1990 that the after applying MACT, the Agency can return to the source category and apply additional controls for residual risk! This issue has not been resolved to date and is one of the reasons the Agency is behind on meeting the MACT schedule identified in the CAAA of 1990. Failure to meet the schedule would require the Agency to set case-by-case MACT standards, which might lead to more stringent application of control technology and emission limits. The Agency would like to prevent a case-by-case MACT program, due to cost and manpower.
Consequently, the Agency has developed a MACT Partnership Program. The program is designed to ease the burden of establishing MACT standards for all source categories and help the Agency meet its schedules for promulgating standards. The program has two phases: Phase I involves the Agency developing a presumptive MACT standard based on limited data it has gathered (without additional stack test). During this phase, EPA and state/local agencies agree on the presumptive standard. Phase II involves final-standard development, which then brings in stakeholders (industry, consultants, affected facilities etc.) for final rule development. The two phase approach reduces the normal time of MACT standard development from 4 years to about 2 years.
(WIP) How Do We Use The Fo Factor in Determining Validity of Orsat/CEM Analysis for O2/CO2?
Γ¥ùNote: I would recommend defining what Fo Factors means in relation to this industry/question
Additionally, the answer references a table that isn’t providedΓ¥ù
Fo factors can be used to evaluate the correctness of the Orsat or CEM system performing analysis for CO2/O2. The following table illustrated the typical range for Fo factors for specific fuel types:
Using the following formula, one can check the accuracy of the Orsat or CEM used to monitor O2 and CO2:
Fo = 20.9- O2/ %CO2
If calculated Fo value does not fall within this range of +/- 10 %, then something is wrong with the reported CO2 and O2 concentrations.
(WIP) Benzoic acid, at high concentrations, has appeared in my field blanks, trip blanks, and samples using SW-846, Method 0010. Is benzoic acid real or a breakdown product of XAD-2 resin?
XAD-2 is a cross-linked styrene-divinylbenzene organic polymer adsorbent. When used for ambient and source testing, the native XAD-2 must be certified clean prior to field application. This requires Soxhlet extraction with an organic solvent ( 10% diethyl ether in hexane or methylene chloride) to remove residual organics (i.e., benzene, toluene or the xylenes) from the surface of the polymer. Consequently, when ready for field use, the XAD-2 should come with a ΓÇ£Certificate of CleanlinessΓÇ¥ from the laboratory indicating that there are no residual organics (i.e, < 4 ug/g of individual organics) on the resin bed. This is very important since the detection limits we are trying to reach are 1.0 ng/m3. Consequently, the benzoic acid should not be a contaminant on freshly extracted XAD-2 resin.
The field and trip blanks should also help one determine what is the source of the benzoic acid. When charging and recovering the Method 0010 sample train, the field blank should be exposed to the same atmosphere as the sample cartridge. This means opening up the field blank and setting it in the same area as where the Method 0010 sample train is being charged or recovered. At the end of each activity, the field blank is capped and stored with the other samples. If benzoic acid is in the atmosphere from fugitive emissions, it would effect both cartridges (sample and field blank) the same. As you recall, the trip blank is never opened. The trip blank is prepared just like a sample, but is never exposed to the atmosphere.
However, because of itΓÇÖs chemical structure, XAD-2 can degrade when exposed to heat, sunlight, and oxidants. To minimize the influence of heat, Method 0010 requires that the source gas entering the resin bed be maintained to < 68 F through the use of a coiled condenser during sampling to prevent deterioration of the XAD-2 resin. In addition, after sampling, Method 0010 requires that the resin bed be maintained at < 4 C until extraction to provide continue integrity of the resin and analytes on the resin.
To minimize the influence of ultraviolet light from breaking down the resin, we suggest that the resin cartridge always be wrapped in hexane-rinsed aluminum foil. This protects the resin from harmful ultraviolet light, once again maintaining integrity of the resin. The aluminum foil also minimizes contamination from hands on the resin cartridge.
The influence of oxidants has only recently come to light. During sampling, we are pulling large volumes of stack gas containing many oxidants (i.e., oxygen, ozone, peroxides etc) through the resin bed. It has been speculated that, during sampling, benzoic acid is produced as an artifact from the oxidation in the stack gases. Polymers like XAD-2, because of their substituted benzene ring structure, slowly degrade and give off compounds like toluene, styrene, and similar compounds that oxidize to yield the benzoic acid during sampling.
Γ¥ùFor more information associated with semi-volatile monitoring and background concentrations of the XAD-2 resin, please contact Tom Ward, US Environmental Protection Agency, MD-74B, Research Triangle Park, North Carolina 27711 (919-541-3788). <– Still true?Γ¥ù
(WIP) What Is The Difference Between Method 9 and SIP Series VE (Methods 203 A, B, and C)? What Is The Difference Between Federal Reference Method 29 and SW-846 Multi-metal Method?
In terms of regulations, EPA has developed a series of methods which address different programs. The sources of the different test methods are as follows:
- 40CFR 60, App. B: 00 Series, Performance Specification Test
- 40CFR 51, App. M: 200 Series, SIP Methods
- 40CFR 60, App. A: 00 Series, Federal Reference Methods
- 40CFR 61, App. B: 100 Series, NESHAP Methods
- 40CFR 63, App. A: 300 Series, MACT Methods
- 40CFR264/265: 0000 Series, SW-846 Hazardous Waste Incinerator Methods
The EPA has promulgated different test methods to address different regulatory standards. Some of these methods are the same method, but identified differently depending upon the regulatory program.
Consequently, there is no difference between FRM 29 and SW-846, Method 0060 for multi-metal sampling and analysis from industrial and hazardous waste incinerators. For more information associated with FRM 29, contact Mr. Bill Grimley, US EPA, EMC, MD-19, Research Triangle Park, NC, 27711, (919) 541-1065.
Methods 203A, B, and C are field test methods, as found in 40 CFR 51, Appendix M (Test Methods for State Implementation Plans), applying Federal Reference Method 9 (40 CFR 60, Appendix A) procedures for state agency inspectors and visible emissions observers to use in determining visible emission compliance with averaging times other than 6 minutes, time exception standards, and instantaneous emission standards. The methods also address visible emission sources other than the traditional stack emission point including sources of fugitive emissions. Γ¥ùFor more information concerning EPA Methods 203 A, B, and C, please contact Mr. Peter Weslin, US EPA, Emission Measurement Center, MD-19, Research Triangle Park, NC, (919) 541-5242. <– Is this still true?Γ¥ù
If A Velocity Profile Has Been Performed on a Two-Set of Ports, One Port Above The Other, Can The NESHAP Test Be Performed At the Lower Port?
(Example: Lower Port 1.5 Diameters Downstream, Upper Port 2 Diameters Upstream)
Alternative test method approval or variation to a Federal Reference Method (FRM) has always been on a ΓÇ£case-by-caseΓÇ¥ basis. At the discretion of the Administrator, the following allowable alternatives can be made:
- Approve minor changes to the reference test methods;
- Approve an equivalent method;
- Approve an alternative method which has been demonstrated adequate for determining compliance at a specific source; and
- Waive the requirements for performance testing.
The Administrator is a Regional EPA official or officials of other agencies, such as regional, state, and local personnel.
In general, for an alternative method to be accepted, it must:
- Be applicable and properly executed;
- Include a detailed, written description of option in test report; and
- Provide supporting data and rationale to show validity of option in the specified application.
In considering an alternative to a Federal Reference Method, Agency criteria for evaluating minor modifications should determine that:
- Effect (or changes to the methodology) will be insignificant on final emission data results;
- Changes will accommodate a situation that is considered unique and would apply only to sample site for which it is allowed;
- All allowable alternative procedures in reference method will provide emission results of equal or greater value than standard procedures (Bias Concept); and
- Agency can use same bias concept technique when evaluating alternative methods.
With reference to the question, the source would have to provide the needed information to show that the two sampling ports are equivalent and that a negative bias does not exist at the lower port. In essence, the source should complete the Alternative Method Approval Request, found at the back of your Student Workbook. This form contains four major sections: 1. Requesting Organization
2. Specific Application of the Alternative Method
3. Description of the Alternative Method
4. Support Data
As part of this request, the source would provide data (to support the selection of the lower port) showing that cyclonic flow does not exist at the lower port, both velocity profiles are representative of the source emissions and do not vary within 10 % of each other, and if a gas test method is being performed, the concentration profiles for O2 (or CO2) are within 10 % of each other as determined by a portable O2/CO2 continuous emission monitoring (CEM) system.
The source would provide this support data as Part 4 of the Alternative Method Approval Request.
(WIP) Has FTIR Been Used in Stack Testing?
FTIR (Fourier-transform infrared) has been used as both emission and process monitoring at primary/secondary aluminum facilities, secondary lead, asphalt roofing, Portland cement plants, and wool fiberglass/mineral wool facilities and utilities. FTIR use has been validated for the determination of over 37 hazardous air pollutants (HAPs) directly, with an additional 18 HAPs through sample concentration. EPA presently maintains a spectra library on the Internet.
FTIR is presently being used to quantitate emissions from a variety of sources. Under 40 CFR Part 63, Appendix A, FTIR is being proposed (tentative: under consideration) for three methods. They are:
- Method 318: Formaldehyde, Phenol, and Methanol Determination by FTIR;
- Method 320: Generic Extractive FTIR Method for Industrial Emissions; and
- Method 321: FTIR For HCl From Portland Cement Kilns.
Method 318 test method using FTIR is industry specific for the mineral wool industry, while Method 321 is industry specific for the Portland cement industry. Method 320 is a generic, self-validating FTIR test method that can be applied to any source category. It has the option for using in screening, validation requirements (Method 301), and self-validation requirements (spiking etc.). Method 321 will be a compliance method using FTIR for HCl emissions from Portland cement plants as part of the MACT regulations. The system uses a heated sample line and a filter maintained at 350 F to control ammonium chloride formation. Method 318 will more than likely be promulgated in the fall of 1998, while Methods 320 and 321 will be promulgated in the spring of 1999.
Γ¥ùFor additional information associated with the application of FTIR to monitoring industrial emissions, please contact Ms. Rima Dishakjian, U.S. Environmental Protection Agency, MD-77A, Research Triangle Park, NC, 17711, (919) 541-0443.
Finally, EPA has produced a video entitled: FTIR for Emission Measurements. Please contact Ms. Dishakjian for receiving a copy. <– Is this still true?Γ¥ù
(WIP) How do I sample for chloroprene?
Chloroprene (C4H5Cl), 2-chloro-1,3-butadiene, has a vapor pressure of 226 mm Hg @ 25 C, a boiling point of 59 C, and a molecular weight of 88.5 g/g-mole. As such, it is classified as a volatile organic compound (VOC).
Being a VOC, one would think that SW-846, Method 0030 would be the ideal choice for capturing chloroprene from stack gases. Indeed, Method 0030 is applicable to those organic compounds with boiling points from 30-100 C, of which chloroprene certainly is a member. However, we have identified chloroprene as questionable using Method 0030. The EPA has data that shows Method 0030 works well in the laboratory under control conditions for capturing chloroprene, but mixed results in the field. It might be that chloroprene breaks through (low breakthrough volume) the Tenax and Tenax/charcoal traps in the Method 0030 sampling train or that oxidants in the stack gas reacts with the captured chloroprene on the resin bed, thus providing a negative bias to our concentration. We really donΓÇÖt know, but can only speculate.
However, the EPA does have data to show that Method 0031 gives good results based upon a Method 301 validation. Method 0031 uses three adsorbent traps (Tenax, Tenax and Anasorb-747). Anasorb-747 is a carbon molecular sieve adsorbent, with large surface area and very amenable to capturing volatile organics. Also remember that Method 0031 allows the sampling rate to be as low as 0.25 L/min, thus allowing considerable more contact time for the organic with the sorbent resins!
Consequently, the method of choice for quantitating chloroprene from industrial sources is SW-846, Method 0031.
The EPA, Emission Measurement Center, Research Triangle Park, NC has posted on their web site relevant methods and procedures for emission testing and monitoring. The website is designed to provide the user guide in the application of stack test methods to specific analytes of interest. The methods are presented under five (5) different categories. The categories are based on a combination of (1) the legal status of the methods with regard to their application under federally enforceable regulations and (2) the validation information available on the method and the AgencyΓÇÖs corresponding confidence in application of the method for its intended use.
Category A: Methods proposed or Promulgated in the FR
These methods are used for compliance purposes under 40CFR 60, 61, and 63 by industrial sources. These methods are being reviewed to meet EPAΓÇÖs new format as recommended by the Environmental Monitoring Management Council (EMMC).
Category B: Source Category Approved Alternative Methods
These methods are approved alternatives to the test methods outlined in 40 CFR 60, 61, and 63. They have been used by sources for determining compliance. The Administrator has issued an official EPA letter stating the validity of the methodology as an alternative to the FRMs
Category C: Conditional Methods
These methods have been evaluated by the Agency and may be applicable to one or more source categories. EPA has reviewed the method QA/QC, applicability to a source category, field and laboratory validation studies etc.
This method may be used by State and local programs in conjunction with Federally enforceable programs (e.g., SIP, Acid Rain, Title V Permits etc.). The source must get approval as alternative before using to meet Federal requirements.
Category D: Preliminary Methods
The performance of these methods is not as well defined as those in the conditional category. May be used in limited application as ΓÇ£gap fillingΓÇ¥ methods.
Category E: ΓÇ£Idea BoxΓÇ¥
Methods concepts to promote information exchange.
Γ¥ùWithin each category, the EPA provides examples of test methods for specific analytes. For more information dealing with the application of source methods to specific analytes, contact Mr. Tom Logan, US Environmental Protection Agency, MD-19, Research Triangle Park, North Carolina, 27711, 919541-2580.
For other applications of SW-846 methods in quantifying your target compounds, please contact Ms. Robin Segall, U.S. Environmental Protection Agency, MD-19, Research Triangle Park, North Carolina, 27711, 919-541-0893. <– Still true?Γ¥ù
(WIP) What Are Some Of The Test Methods Available For Monitoring Sulfur Compounds?
Within 40 CFR 60, Appendix A, there are several Federal Reference Methods (FRMs) which are used to monitor both the oxides of sulfur and reduce sulfur compounds. Federal Reference Methods 6 and 8 deal with the oxides of sulfur. Federal Reference Methods 15, 15A, 16, 16A, and 16B deal with the reduced states of sulfur and total reduced sulfur (TRS) compounds.
New techniques have developed over the last several years in monitoring reduce sulfur compounds. Field and laboratory tests have demonstrated the applicability of specially-treated interior whole-air canisters as a sampling mechanism for reduce sulfur compounds. In this application, a gas sample is extracted from the source through a heated sample probe directly into a heated specially-treated interior whole-air canister. After extraction, the canister (still heated) is immediately taken to an on-site laboratory for analysis using gas chromatography coupled to a flame photometry detector or a mass spectrometer. The National Council for Air and Stream Improvement (NCASI) has validated this method (using Method 301) for many organic HAPs, and some reduce sulfur compounds from Kraft recovery boilers.
Other techniques include extractive FTIR, portable gas filter correlation (GFC) systems, ion mobility, specific gas permeation cells and a variety of continuous emission monitoring systems (CEMs). Other techniques for monitoring reduce sulfur compounds from industrial sources can be found in a variety of databases.
There are many different databases available for assisting the analyst in determining which sampling and analytical procedure to use for a particular analyte. Most of the databases are multi-media, containing information involving both water, soil, hazardous waste and air. Some of the more useful databases are:
- Γ¥ùLewis Publishing Company, Compilation of EPAΓÇÖs Sampling and Analysis Methods Database. This database contains 650 method and analyte summaries. Each summary includes method name and EPA number, analyte, CAS registry number, instrumentation, method detection limits, sampling and sample container requirements, and more.
- U.S. Environmental Protection Agency, EPA Environmental Monitoring Methods Index (EMMI) Database, National Technical Information Service (NTIS), 5285 Port Royal Road, Springfield, VA, 22161, (703) 487-4650, E-mail: Info@NTIS.FEDWORLD.GOV, Internet: https://www.ntis.gov. The EMMI database is an automated inventory of information on environmental significant analytes monitored by the EPA and methods for their analysis. The EMMI System serves for enhancement and national distribution to Regional EPA laboratories and offices as the single authoritative source for cataloguing the AgencyΓÇÖs analytical methods. The EMMI database includes information on more than 2,600 analytes from over 80 regulatory and nonregulatory lists and more than 900 analytical methods.
- U.S. Environmental Protection Agency, Air Methods Database, Office of Emergency and Remedial Response, Edison, NJ, (908) 321-6738. The Air Methods Database is a PC-based software package which allows the user to access summarized standard methods for chemical sampling and analysis associated with air emissions. These summaries are used by the user as tools for applicability of a method for an analyte, method detection limits, operating range, and interferenceΓÇÖs of the method and the type of media and sampler used top collect the analyte.Γ¥ù <– Still true?
Additionally, NTIS publishes a pamphlet entitled ΓÇ£Environmental Software and DatafilesΓÇ¥ annually. These pamphlets contain additional sources of current sampling and analytical methods and simulation models, software and datafiles containing test results and chemical properties, and statistical methods.
(WIP) What do I watch for during the resin recovery involved in SW-846, Method 0010?
During the resin recoveries involved with both Method 0010 (Semi-VOST) and Method 0030 (VOST), observe how the resin beds are handled and stored. Are they wrapped in hexane-rinsed aluminum foil to minimize outside influences of ultraviolet light, heat and external contamination? Does each cartridge have a ΓÇ£Certificate of CleanlinessΓÇ¥ associated with itΓÇÖs paperwork? Is each cartridge inscribed with a unique number/letter to identify that cartridge to that specific test run? Is the field blank cartridge exposed to the same atmosphere as the sample cartridge during charging and recovering of the sample train?
During your review, make sure the cartridges are properly capped when not in use and that they are stored at < 4C at all times after sampling. Confirm that the Chain-of-Custody (COC) is properly filled out and the cartridges are properly identified on the COC. Check to see when the cartridges were cleaned (should be on the ΓÇ£Certificate of CleanlinessΓÇ¥ sheet and if the sampling date is within 30 days of that date (Both Method 0010 and 0030 require that the clean cartridges must be used within 30 days from cleaning). Finally, if the cartridge is being used for dioxin/furan sampling (Method 0023A), then insure that proper field surrogates have been applied to the certified clean cartridge prior to sampling (remember, Methods 0010 and 0030 do not require field surrogates to be added to the sample cartridge).
Γ¥ùFor additional information concerning sorbent recoveries, please contact Mr. Gary McAlister, U.S. Environmental Protection Agency, MD-19, Research Triangle Park, North Carolina 27711 (919-541-1062).Γ¥ù <– Still true?
How important is the use of aluminum foil in the protection of the resin beds in SW-846, Method 0010 and 0030?
Aluminum foil serves three purposes to minimize biases associated with Methods 0010 and 0030. First, the hexane-rinsed aluminum foil prevents ultraviolet light from effecting the resin bed and analytes attached to the resin bed. Second, the aluminum foil helps to minimize the influence of heat from either the sun or the stack. In addition, the application of the aluminum foil helps to minimize influence of outside contamination on the walls of the cartridge.
Sometimes in stack testing, it is the small things that can add up to create large biases in the test data. The aluminum foil helps us to maintain some small biases within our accepted control limits.
(WIP )Why is it necessary to purge the filter in the HCl/Cl2 train and why do a leak check in two sections?
SW-846, Method 0050 was designed to sample HCl/Cl2 from hazardous waste incinerators and municipal waste combustors, especially suited for those sources with wet scrubbers emitting acid particulate matter (e.g., HCl dissolved in water droplets). As such, Method 0050 requires isokinetic sampling to insure a representative sample is extracted from the stack. The water droplets containing the dissolved HCl would be extracted in a representative manner from the passing stack gas around the nozzle. However, after the droplets enter the gas sampling train, they may fall out in the optional cyclone or be retained on the heated filter. To address this bias, the method calls for purging the sample train for 30 minutes (purge air through an Ascarite tube) to vaporize the liquid and purge any HCl in the cyclone or retained on the filter and pull it through the train and into the first three impingers. Tests by the EPA have demonstrated that if visible moisture is still in the cyclone or on the filter, then increasing the probe/filter assembly to 177 C with additional purging of 15 minutes will insure complete removal of the HCl from the cyclone/filter to the impinger system.
The two tier leak check procedure identified in Method 0051 (remember, Method 0050 requires a standard FRM 5 full train leak check) requires a leak check of the probe and three-way stopcock, then a leak check from the first impinger through the rest of the sample train. The two tier leak check would allow the stack tester to leak check the probe and three-way valve only one time. The probe/valve assembly would stay in the stack until the end of the testing day. This would allow the tester to run several test, exchanging out the impingers several times and leak checking the impinger/meter box only without removing the probe/three-way valve from the port. This saves some time when multiple runs/tests are being performed at the source.
Indeed, a single whole train leak check can be done each time, which is stricter than what Method 0051 requires.
Γ¥ùFor more information associated with FRM 26, please contact Mr. Terry Harrison, U.S. Environmental Protection Agency, MD-19, Research Triangle Park, North Carolina 27711 (919-541-5233). <– Still true?Γ¥ù
What are the differences between the different ΓÇ£blanksΓÇ¥ used in Stack Testing – Lab, Field, Reagent, and Trip?
There are several different ΓÇ£blanksΓÇ¥ associated with stack testing methodology. They are field, trip, reagent and laboratory blanks. The objective of determining concentration of analytes in the different blanks is to verify the presence or absence of analytes, either those of concern [consequently, those on the target compound list (TCL)] or those analytes which might effect the results through positive or negative biases.
- The trip blank is designed to identify levels of contamination from the exposure of the reagent or sorbent bed to the same atmospheres exposed to the analyte reagent or sorbent bed. The trip blank is prepared in the laboratory with the other reagents or adsorbents prior to shipping to the field. However, the trip blank is never exposed to the field atmospheres. It is simply sent along with the field samples to and from the site. The trip blank identified areas of exposure such as shipping temperatures and pressures, laboratory preparation of field samples and laboratory preparation of field samples for analysis.
- The field blank is similar to the trip blank in that it is also prepared during the preparation of the field reagents or adsorbents. However, the field blank is exposed to the same atmospheres in the field as the field samples. This means that the field blank is opened during the charging of impingers or sorbents in the sample train. The field blank is also exposed during the exchanging of cartridges in SW-846, Method 0030 or when field reagents are being exchanged during a test run. In summary, field blanks consist of additional sample collection media (e.g., sorbent tubes, reagents, filters) which are transported to the monitoring site, exposed briefly at the site when the samples are exposed (but no stack gas is actually pulled through these blanks), and transported back to the laboratory for analysis, similar to a field sample. At least one field blank should be collected and analyzed for each test series.
- The laboratory blank is a sample of the reagents or sorbents used during the sample train reagent preparation or recovery. The laboratory blank is a sample of the extraction solvent, the rinses used during sample recovery, or a sample from the batch of sorbent used to preparing sampling cartridges. Laboratory blanks include both method blanks and instrument blanks. method blanks are carried through all steps of the measurement process (from extraction through analysis). A method blank is typically analyzed with each sample batch. Instrument blanks are used to demonstrate that an instrument system is free of contamination. Instrument blanks are typically analyzed prior to sample analysis and following the analysis of highly contaminated samples.
- The reagent blank is a sample of the solvents used during recovery of the sample train after the test is completed. Reagent blanks for both multi-metal and chromium +6 require that the reagent blank be the same volume as the renses used to recover the samples, from probe to impinger. This is because the blank value is substracted from the sample to obtain a final concentration.
How does Method 0050 differ from FRM 26 or 26A for HCl?
SW-846, Method 0050 is an isokinetic sampling train for the determination of HCl/Cl2 from hazardous waste incinerators and municipal waste combustors, especially suited for those sources with wet scrubbers emissions of acid particulate matter (e.g., HCl dissolved in water droplets. Method 0051 was designed for those stacks which were relatively dry, particulate free. You must use Method 0050 at sources controlled by wet scrubbers that emit acid particulate matter and have water droplets.
Federal Reference Method (FRM) 26 is the same as SW-846, Method 0051 except FRM 26 is for hydrogen chloride (HCl) emissions only (whereas Method 0051 can quantitate Cl2 also). Finally, FRM 26A is different from SW-846, Method 0050 (both isokinetic), in that FRM 26A is applicable for determining emissions of hydrogen halides (HX) [specifically HCl, HBr, and HF], and halogens (X2) [specifically Cl2 and Br2]. Method 0050 only quantitates HCl and Cl2.
We see a lot of field blank contamination. The stack test companies usually explain this a ΓÇ£laboratory artifactsΓÇ¥ or ΓÇ£false positives.ΓÇ¥ How much ΓÇ£blank contaminationΓÇ¥ should be accepted?
There is no general rule as for a acceptable blank contamination. Of course, you do not want to have your target analytes as part of the ΓÇ£blank contaminationΓÇ¥ above the method detection limits (MDLs).
As specified in the individual methods, the following ΓÇ£blank contaminationΓÇ¥ levels are required to be met before the sorbent is allowed to be used in the sample train:
- Method 0010 (Semi-volatile): 4 mg/kg of total chromatographable organics (TCO);
- Method 0030 (Volatile): 2 ng/1.6 g of target specific analyte;
- Method 0050 (HCl/Cl2): Reagent blank less than 10 % of the sample values; and
- Method 0060 (Multi-metals): Reagent blank less than 2 ug/L of each target metals.
Is the Ascarite purge in Method 0050 required for all runs?
The objective of the Ascarite purge in Method 0050 is to move any entrained HCl/Cl2 on the heated filter or in the optional glass cyclone back to the impingers. This is accomplished by attaching an Ascarite scrubber to the inlet of the probe, with the filter heated to 248 F, purging the train for up to 45 minutes at a desired flowrate of 1 inch of water as indicated by the delta H manometer. The EPA has found that if visible water is observed in the optional cyclone, one can increase the temperature of the filter box to 177 C to help vaporize the water, consequently moving the entrained HCl/Cl2 to the impingers.
In Method 0050, why use sulfuric acid to trap HCl (and how does it work)? Why not use a base solution?
As specified in Method 0050, two impinger reagents are used to separate and trap HCl and Cl2 from the gas stream. Acidic and alkaline absorbing solutions collect gaseous HCl and Cl2, respectively. In the acidified water absorbing solution (i.e., 0.1 N H2SO4), the HCl gas is soluble and forms chloride ions by the following equation:
HCl + H2O = H3O+ + Cl-
The Cl2 gas present in the emissions has a very low solubility in acidified water and
passes through to the alkaline absorbing solution where it undergoes hydrolysis to form a proton (H+), Cl-, and hypochlorous acid (HClO) by the following reaction:
H2O + Cl2 = H+ + Cl- + HClO
Sodium thiosulfate solution is added to the contents of the recovered alkaline absorbing solution ( e.g., 0.1 N NaOH) to stabilize the ClO- and removes the possibility of partial reduction of ClO- to Cl- and the resulting high bias to the results.
The resulting Cl- ions in the separate solutions are measured by ion chromatography by SW-846, Method 9057. Those Cl- ions found in the acidified impingers are related to the HCl emissions and those in the alkaline impingers are related to the CL2 emissions. Thus, through the selection of absorbing solutions and solubilities, we are able to differentiate between HCl and Cl2.
To use only a base wouldnΓÇÖt allow us the ability to speciate and we would also have to change our analytical finish because of the many possible reactions in the base impinger with absorbing HCl along with Cl2.
(WIP) Is the addition of a pH color indicator (~ pH 9 or 8) in the last NaOH impinger allowed in Method 0050/0051?
Jerry Winberry: I have checked with EPAΓÇÖs Emission Measurement Center (EMC) involving the addition of a pH indicator to the last NaOH impinger to show the visual change in color if the normality of the NaOH changes below 0.1 N (pH ~ 10). The EPA has not received a request for approval of the methodology by adding a color indicator to the impinger.
However, thymolphthalein is blue at a pH of > 11, but becomes colorless at a pH < 10. I would see nothing wrong with adding a few drops of thymolphthalein in the last impinger as an indicator of pH change during sampling rather than stopping the test and having to leak check before checking the pH of the last impinger. Do not forget you must receive prior approval from the Administrator before implementation.
Additionally, donΓÇÖt forget our other options to maintaining proper strengths of our absorbing solutions:
- Use stronger base (e.g., 0.5 N NaOH);
- Add additional volume to the last impinger ( e.g., 200 mL); and
- Recharge impinger during sampling.
Why is FRM Method 18 not recommended for HAP testing? Where could FRM Method 18 be used?
Federal Reference Method 18 was promulgated in the Federal Register, 48 FR 48344, October 10, 1983. Since that time, the method has undergone corrections and updates. On April 22, 1994, the method underwent an update for improving the quality assurance/quality control (QA/QC) sections of FRM 18.
When originally promulgated, the method was intended to be used as both a survey method to gain information as to what organics were being emitted from industrial sources and as input to agency models for regulatory activities. FRM 18 is very similar to SW-846, Method 0040, Sampling of Principal Organic Hazardous Constituents from Combustion Sources Using Tedlar Bags. Both methods are sample collection methods, with references to other FRM or SW-846 analytical methods for the analysis of the specific target compound list. However, FRM 18 goes into great detail on how to analyze the survey Tedlar bag on-site by using various techniques for calibrating the gas chromatography system.
As identified in Section 2.1 of FRM 18, the ΓÇ£range of this method is from about 1 part per million (ppm) to the upper limit governed by GC detector saturation or column overloading. The upper limit can be extended by diluting the gases with an inert gas or by using smaller gas sampling loops.ΓÇ¥ Consequently, FRM 18 is truly applicable to those sources with emissions of gaseous organic compounds in the ppm range. Since the method allows for ΓÇ£dilutionΓÇ¥ of the stack gas with inert gas using a Tedlar bag technique, the method is not sensitive to low ppb levels of organics. As you recall in SW-846, Method 0030, we used a Tenax, Tenax/charcoal tubes to capture the hazardous organic constituents from the stack gas. After collection, we performed a ΓÇ£thermal desorptionΓÇ¥ on the tubes to reach the desired detection limits needed for risk base calculations. Those detection limits were in the 1 ppb range. Whereas, SW-846, Method 0040 is in the 100s ppb range and FRM 18 in the 1 ppm range.
What stack test method is used to sample diallyl phthalate (DAP)?
Jerry Winberry: Diallyl phthalate (DAP) is a nearly colorless liquid, and is insoluble or has limited solubility in gasoline. It is soluble in most organic liquids, however. It is also a primary plasticizer for most resins, and is a polymerizable monomer which will polymerize with heat and catalyst into a clear, hard, insoluble polymer.
Diallyl phthalate has a boiling point of 158-165 C ( 4 mm) and a vapor pressure of 1.5 mm at 150 C. Diallyl phthalate is therefore defined as a ΓÇ£semi-volatile.ΓÇ¥
SW-846, Method 0010 would be the best selection for a method to extract and quantitate diallyl phthalate from a source. Since diallyl phthalate is not a traditional semi-volatile using Method 0010, I would suggest, as does the method, performing several laboratory evaluations of spiking known concentrations of DAP on clean, certified XAD-2 cartridges.
First set of experiments would to evaluate the extraction efficiency of XAD-2 releasing the DAP to the extraction solvent. This experiment would require spiking three (3) XAD-2 cartridges with neat DAP (spiking in the center of the XAD-2 resin bed) at concentrations expected from the source. You would then perform a normal Soxhlet extraction to determine the system efficiency (remember, the XAD-2 resin bed must also be spiked with the normal laboratory surrogates). The recovery of the DAP from the XAD-2 cartridges must fall within Method 0010 surrogate recovery limits of 50-150 %.
The second set of experiments would involve spiking three (3) cartridges with the same level of DAP as used in the extraction experiment. This time, the XAD-2 is challenged with clean, ambient air for the same sampling period as Method 0010 sampling time would require. The XAD-2 cartridges would be recovered in the same manner, soxhlet extracted and analyzed by GC/MS. Once again, the recovery limits would be 50-150 %.
During this experiment, you are determining whether the DAP will remain on the XAD-2 resin bed during sampling and whether there is any possibility of degradation of the DAP during sampling.
On the ambient side, we have excellent recoveries of DAP using combination of polyurethane foam (PUF)/ XAD-2 cartridges for trapping phthalates from ambient air. Our laboratory experiments show an average of 92 % recovery for most of the phthalates. Based upon that experience, I feel that SW-846, Method 0010 will be adequate for DAP.
(However, the phthalates can be a background problem for XAD-2 resin. I would therefore suggest that you clean, certify the resin to show that you do not have phthalates as background concentration on the resin, but use the resin only once. Use clean resin each time to minimize possible problems.)
If the KOH recirculation pump fails for a period of time (i.e., 20 minutes), must the test be invalidated for Method 0061?
Shouldn’t the FRM 201A isokinetic be between 80-120 % rather than 60-140%?
FRM 201A does state in Section 6.3.5 that the allowable acceptable limits for isokinetics is between 80-120 % or that no sampling point be outside the delta p min or delta p max during sampling.
FRM 201A is sampling at a constant rate through a PM-10 cyclone. The objective of FRM 201A is to maintain the correct flow through the nozzle, consequently the PM-10 cyclone, to maintain the proper cut-side of the cyclone (9-11 microns) during sampling. By not sampling isokinetically, as in Method 201, we are ignoring the larger particles. Our assumption is that our bias will be small because we are only interested in the small particles (< 10 microns) which will follow the gas stream and enter our nozzle if we select a constant sampling rate that is close to 100 % isokinetics based upon the geometry of the cyclone and nozzle selection. Maintaining the proper cut-size of the cyclone is the most important aspect of this method, not the % isokinetic limit.
Jerry Winberry: Consequently, if I was reviewing a FRM 201A test report and they showed that the cyclone cut-size was maintained with the 9-11 micron size range, but isokinetics were 75 %, I would accept the test knowing that I am only interested in small particles (< 10 micron). Remember, under isokinetics biases the mass emission high or in favor of the regulatory agency!
On Method 0061, can both chromium and Cr+6 be measured in the same test? If someone wanted only total chromium, wouldnΓÇÖt it be better to run the multi-metal train (Method 0060)?
SW-846, Method 0061, Determination of Hexavalent Chromium Emissions From Stationary Sources, is applicable for the determination of Cr+6 from hazardous waste incinerators, municipal waste incinerators, and sewage sludge incinerators. With the approval of the Administrator, this method may also be used to measure total chromium.
For total chromium, you would operate the Method 0061 sampling train in the same manner for Cr+6, but would rinse all active components of the sample train (from probe inlet to the fourth impinger) with 0.1 M HNO3 for total chromium. Remember, one filters the insolubles from the 0.1 N KOH recovered solutions and analyze the insolubles for total chromium also (along with the 0.1 M HNO3 rinses). Consequently, the total chromium number would be the Cr+6 number plus the insoluble total Cr number plug the 0.1M HNO3 total Cr rinse.
For total chromium only, it would be easier to operate the multi-metals train (SW-846, Method 0060, without the KMNO4 impingers for Hg) rather than the Cr+6 train because of the special adaptor for the probe assembly and recirculating first impinger.
Is stack velocity ΓÇ£directlyΓÇ¥ proportional to the absolute temperature, since PV=nRT?
Stack velocity is NOT directly proportional to absolute temperature. The Ideal Gas Equation is PV=nRT, where ΓÇ£VΓÇ¥ is volume of a gas in relationship to the temperature, ΓÇ£TΓÇ¥ of the gas.
Velocity of a gas stream is determined by the following equation:
V = KpCp [(Ts)(delta p)/(Ps)(Ms)]1/2
Now, Qs = (As)(vs) where As is the area of the stack and vs is the velocity of the stack gas.
The pmr (pollutant mass rate) = (cs)(Qs) where cs is the concentration of the pollutant (mass per unit volume) and Qs is the volumetric flow rate of the stack gas [(As)(vs)].
(WIP) Would you consider FTIR as an approved EPA method? What is the reference to the EPA protocol?
Γ¥ùThis entire section references works that are not linked, they either need to be provided or this entire answer needs to be redoneΓ¥ù
Indeed, FTIR is a ΓÇ£mainstream ΓÇ£ method for the EPA. In support of the MACT regulations, the EPA has promulgated and proposed several FTIR methods to help states determine whether sources are meeting their emission limits. Under 40 CFR Part 63, Appendix A, the various FTIR methods applicable to state to use in their SIP programs as part of the MACT program are discussed. The 300 series found in 40CFR63 include the following FTIR methods:
- Method 320- FTIR Extractive Technique Applicable to Emission Sources (Proposed March 24, 1998);
- Method 321- FTIR For HCl Emissions (Proposed March 24, 1998);
- Method 318- FTIR For Phenols, CO, COS, and Methanol (Proposed March 31, 1997);
- Performance Specification Test (PST) 15- FTIR CEMS (Promulgated, Fall, 1998).
Additionally, as part of The Compendium of Methods for Sampling and Analysis of Organic Compounds in Ambient Air-Second Edition, there is the Compendium Method TO-16 dedicated for the application of FTIR technology for monitoring organic emissions in the ambient air. If you would like a copy of this method, Γ¥ùplease contact Jerry Winberry. He is the principle author of the Organic Compendium.
For more information about the applicability of FTIR to source emissions, contact Rima Dishskjian of EPAΓÇÖs EMC at RTP (919-541-0443).Γ¥ù
Intro to Isokinetic Sampling
This video briefly covers:
1. Intro to Isokinetic Sampling
2. Our contribution to the industry
3. What we can do for you
Intro to EPA Method 2 and Flow Measurement
In this video we cover:
1. Brief introduction to US EPA Method 2
2. The challenges problems involved in performing method 2.
3. Our available systems for Method 2, 2F, and 2G.*
*Apex Instruments is constantly striving to create better products and improve existing ones. For the most up-to-date information on our available products, please visit our website.
If you have any questions, please contact an Apex Instruments Sales Representative.
Sales@apexinst.com
What is Method 4?
EPA Method 4 is used to determine the moisture content of stack gases. A gas sample is extracted at a constant rate from the source. Moisture is then removed from the sample stream and the condensate is measured either by volume or by mass. While Method 4 can be run independently, it is often conducted with a pollutant emission measurement run, such as Method 5.
For more information and documents about Method 4, please consult the EPA’s Method 4 webpage.
Apex Instruments offers a Method 4 Sampling Kit. If interested in Method 4 sampling, Apex Instruments works with our customers to make sure we are providing the correct products for your project and will provide you with a price quote. For any questions about our sampling kit, please contact sales@apexinst.com.
Equipment Needed for Method 4:
ΓùÅ Probe
Γùï M5 style
Γùï Stainless steel tubing
ΓùÅ Gas extracting pump
Γùï Console
Γùï Tedlar bag pump
ΓùÅ Sample line
Γùï M5 or M4 style, or Teflon tubing
ΓùÅ Impingers
Γùï M5 or M4 style impinger train setup
ΓùÅ Pre-filter optional
ΓùÅ Dry bulb, wet bulb
What is Method 5?
Particulate matter is withdrawn isokinetically from the source and collected on a glass fiber
filter maintained at a temperature of 120 ┬▒14 ┬░C (248 ┬▒25 ┬░F) or such other temperature as
specified by an applicable subpart of the standards or approved by the Administrator for a
particular application. The PM mass, which includes any material that condenses at or above the
filtration temperature, is determined gravimetrically after the removal of uncombined water. Method 5 can be run in combination with other isokinetic methods (M23, M26A, M29, M202).
For more information and documents about Method 5, please consult the EPA’s Method 5 webpage.
Information on Methods 5A-I can be found via the EMC Promulgated Test Methods Directory.
Apex Instruments offers a Method 5 Sampling Train. We also offer products for different versions of Method 5. If interested in Method 5 sampling, Apex Instruments works with our customers to make sure we are providing the correct products for your project and will provide you with a price quote. For any questions about our sampling train, please contact sales@apexinst.com.
Required Sampling Parameters for Method 5
ΓùÅ Sampling duration: typically 60-120 minutes
ΓùÅ Sampling rate: typically 0.50-0.75 dscfm
ΓùÅ Minimum sampling volume: 30-60 dscf (dependent on analyte MDLs and expected
concentrations)
Review 40 CFR Part 60 for minimum sampling duration, volumes and filter/gas temperatures.
Equipment needed for Method 5
ΓùÅ M5 Console
ΓùÅ Hot box (filter holder), which connects the probe and the sampling train with a heated filter.
Γùï Includes heating element to maintain filter temperature of 121┬░C (248 ┬░F)
Γùï Filter housing holds the filter within this box to prevent moisture
Γùï Offers flexibility for vertical and horizontal traverses
Γùï Insulated box maintains heat in various environments
ΓùÅ Impingers (condenser train) provide support and protection for glassware
Γùï Insulated case keeps impingers cool
Γùï Holding container for ice to cool impingers (typically below 20 ┬░C or 68 ┬░F)
Γùï Can be attached to hot box or detached, connected by a sample line
ΓùÅ Umbilical line that is lightweight, easily repaired, and covered in a protective sheath (braided cover), and includes:
Γùï One (1) kink-free, wire reinforced sample line
Γùï Three (3) kink-resistant polyethylene lines
Γùï Two (2) black and white/blue pitot
Γùï One (1) yellow orsat line
Γùï Five (5) type K thermocouple (TC) extensions, and
Γùï One (1) five conductor electrical cable with 4 -pin circular connectors (amphenol)
ΓùÅ Meter console
ΓùÅ Vacuum pump
ΓùÅ Sampling probe assembly, which measures flow (with attached pitot), sample (with attached nozzle/liner), and stack gases (with orsat line)
Γùï Probe must have a heating system capable of maintaining gas temperature of typically 121 ┬▒ 14 ┬░C (248 ┬▒ 25 ┬░F).
Γùï Must be capable of measuring stack gas temperature.
Γùï Thermocouple (TC) must be calibrated.
Γùï Probe sheath assembly configurations:
Γûá Hastelloy C276 up to 427 ┬░C (800 ┬░F)
Γûá Stainless steel up to 650 ┬░C (1200 ┬░F)
Γûá Alloy 600 up to 871 ┬░C (1600 ┬░F)
Γùï Probe liner tube must be constructed of material determined by temperature/compounds being monitored:
Γûá Teflon liners up to 177 ┬░C (350 ┬░F)
Γûá Borosilicate glass liners up to 480 ┬░C (900 ┬░F)
Γûá Stainless steel liners up to 650 ┬░C (1200 ┬░F)
Γûá Quartz liners up to 900 ┬░C (1650 ┬░F)
Γùï Sample Nozzle, made of seamless, stainless steel tubing, borosilicate glass, Teflon, or other materials such as quartz when approved by an administrator.
Γûá Button-hook/elbow design
Γûá Sharp, tapered leading edge (< 30┬░ angle)
Γûá Constant internal diameter
Γùï Sampling Train
Γûá Standard glassware features extra heavy borosilicate glass with unground #28 ball and socket joints with o-ring seals.
Γûá Unground joints are more durable than ground joints and the o-rings provide a tight, leakfree seal.
What is Method 202?
Methods 5, 17, and 201A are relevant to performing Method 202. To meet the requirements of the filterable PM test method used in conjunction with Method 202, you must maintain isokinetic sampling conditions. In addition, you must sample at the required number of sampling points, which are specified in Method 5 of appendix A-3 to part 60, Method 17 of appendix A-6 to part 60, or Method 201A of appendix M to this part.
The CPM is collected in dry impingers after filterable PM has been collected on
a filter maintained as specified in either Method 5 of appendix A-3 to part 60, Method 17 of
appendix A-6 to part 60, or Method 201A of appendix M to this part. The organic and aqueous
fractions of the impingers and an out-of-stack CPM filter are then taken to dryness and weighed.
The total of the impinger fractions and the CPM filter represents the CPM.
For more information and documents about Method 202, please consult the EPA’s Method 202 webpage.
Apex Instruments offers a Method 202 Sampling System. If interested in Method 202 sampling, we work with our customers to make sure we are providing the correct products for your project and will provide you with a price quote. For any questions about our system, please contact sales@apexinst.com.
What is Method 8?
A gas sample is extracted isokinetically from the stack. The H2SO4 and the SO2 are separated,
and both fractions are measured separately by the barium-thorin titration method.
U.S. EPA Reference Method 8 was originally developed to test emissions from sulfuric acid plants but has been adapted to sample emissions from many sulfur dioxide sources.
For more information and documents about Method 8, please consult the EPA’s Method 8 webpage.
Apex Instruments offers a Method 8 Sampling Kit. If interested in Method 8 sampling, Apex Instruments works with our customers to make sure we are providing the correct products for your project and will provide you with a price quote. For any questions about our sampling kit, please contact sales@apexinst.com.
What is Method 17?
Particulate matter is withdrawn isokinetically from the source and collected on a glass fiber
filter maintained at stack temperature. The PM mass is determined gravimetrically after the
removal of uncombined water.
For more information and documents about Method 17, please consult the EPA’s Method 17 webpage.
Apex Instruments offers a Method 17 Sampling System. If interested in Method 17 sampling, Apex Instruments works with our customers to make sure we are providing the correct products for your project and will provide you with a price quote. For any questions about our sampling system, please contact sales@apexinst.com.
What is Method 23?
This method is applicable to the determination of polychlorinated dibenzo-pdioxins (PCDD’s) and polychlorinated dibenzofurans (PCDF’s) from stationary sources. A sample is withdrawn from the gas stream isokinetically and collected in the sample probe, on a glass fiber filter, and on a packed column of adsorbent material. The sample cannot be separated into a particle vapor fraction. The PCDD’s and PCDF’s are extracted from the sample, separated by high resolution gas chromatography, and measured by high resolution mass spectrometry.
For more information and documents about Method 23, please consult the EPA’s Method 23 webpage.
On March 20th, 2023, the EPA published revisions to Method 23. You may find that information here.
Apex Instruments offers a Method 23 Sampling Kit. If interested in Method 23 sampling, Apex Instruments works with our customers to make sure we are providing the correct products for your project and will provide you with a price quote. For any questions about our sampling kit, please contact sales@apexinst.com.
What is Conditional Test Method-13/Method 8A?
Controlled Condensate (CTM-13 / 8A) is an alternative to EPA Method 8 for determining sulfuric acid emissions. Sulfuric acid vapor or mist and the sulfur dioxide are separated by controlling the condensation based on the difference in dew points: both fractions are measured separately by the barium-thorin titration method.
This method is applicable for the determination of sulfuric acid
vapor or mist (including sulfur trioxide, and in the presence of other particulate
matter) and sulfur dioxide emissions from kraft recovery furnaces. Tests have
shown the minimum detectable limits of the method are 0.50 milligrams/cubic
meter (3.1 x 10⁻⁸ lb/ft3) for sulfur trioxide. No upper limits have been established.
Based on theoretical calculations, for 200 mL of 3% hydrogen peroxide solution,
the upper concentration limit for sulfur dioxide in a 1.0 m3 (35.3 ft3) gas sample is about 12,500 mg/m3 (7.7 x 10⁻⁴ lb/ft3). The upper limit can be extended by increasing the quantity of peroxide solution in the impingers. Possible interfering agents of this method are fluorides, free ammonia, dimethyl aniline and recovery furnace salt cake.
For more information and documents about CTM-13, please consult the EMC Conditional Test Method Directory.
Apex Instruments offers a Controlled Condensate Sampling System. If interested in CTM-13 sampling, Apex Instruments works with our customers to make sure we are providing the correct products for your project and will provide you with a price quote. For any questions about our sampling system, please contact sales@apexinst.com.
What is Method 25A?
This method is applicable for the determination of total gaseous organic
concentration of vapors consisting primarily of alkanes, alkenes, and/or arenes (aromatic
hydrocarbons). The concentration is expressed in terms of propane (or other appropriate organic
calibration gas) or in terms of carbon.
A gas sample is extracted from the source through a heated sample line and glass fiber filter
to a flame ionization analyzer (FIA). Results are reported as volume concentration equivalents of
the calibration gas or as carbon equivalents.
For more information and documents about Method 25A, please consult the EPA’s Method 25A webpage.
Apex Instruments offers a Method 25A Sampling System. If interested in Method 25A sampling, Apex Instruments works with our customers to make sure we are providing the correct products for your project and will provide you with a price quote. For any questions about our sampling system, please contact sales@apexinst.com.
What is Method 26A?
Method 26A is the isokinetic alternative to Method 26. This method is particularly suited for sampling sources controlled by wet scrubbers emitting acid droplets. The method requires a Method 5 sampling train with the use of additional impingers, reagents, and PTFE-coated glass fiber filter media.
Gaseous and particulate pollutants are withdrawn isokinetically from the source
and collected in an optional cyclone, on a filter, and in absorbing solutions. The cyclone collects
any liquid droplets and is not necessary if the source emissions do not contain them; however, it
is preferable to include the cyclone in the sampling train to protect the filter from any liquid
present. The filter collects particulate matter including halide salts but is not routinely recovered
or analyzed. Acidic and alkaline absorbing solutions collect the gaseous hydrogen halides and
halogens, respectively. Following sampling of emissions containing liquid droplets, any halides/halogens dissolved in the liquid in the cyclone and on the filter are vaporized to gas and
collected in the impingers by pulling conditioned ambient air through the sampling train. The
hydrogen halides are solubilized in the acidic solution and form chloride (Cl−), bromide (Br−),
and fluoride (F−) ions. The halogens have a very low solubility in the acidic solution and pass
through to the alkaline solution where they are hydrolyzed to form a proton (H +), the halide ion,
and the hypohalous acid (HClO or HBrO). Sodium thiosulfate is added to the alkaline solution to
assure reaction with the hypohalous acid to form a second halide ion such that 2 halide ions are
formed for each molecule of halogen gas. The halide ions in the separate solutions are measured
by ion chromatography (IC). If desired, the particulate matter recovered from the filter and the
probe is analyzed following the procedures in Method 5.
NOTE: If the tester intends to use this sampling arrangement to sample concurrently for
particulate matter, the alternative Teflon probe liner, cyclone, and filter holder should not be
used. The Teflon filter support must be used. The tester must also meet the probe and filter
temperature requirements of both sampling trains.
For more information and documents about Method 25A, please consult the EPA’s Method 25A webpage.
Apex Instruments offers a Method 25A Sampling Train. If interested in Method 25A sampling, Apex Instruments works with our customers to make sure we are providing the correct products for your project and will provide you with a price quote. For any questions about our sampling train, please contact sales@apexinst.com.
What is Method 29?
The Method 29 determination of metal emissions from hazardous waste incinerators involves a modification of the Method 5 train. The sampling train is the same as a Method 5 particulate train with the addition of up to three impingers to enhance the collection of metals of interest. The impinger train requires the SB-4 impinger case, glass nozzle and probe liner, and a non-metallic union. The method has been validated for the collection of 17 different metals.
A stack sample is withdrawn isokinetically from the source, particulate emissions
are collected in the probe and on a heated filter, and gaseous emissions are then collected in an
aqueous acidic solution of hydrogen peroxide (analyzed for all metals including Hg) and an
aqueous acidic solution of potassium permanganate (analyzed only for Hg). The recovered
samples are digested, and appropriate fractions are analyzed for Hg by cold vapor atomic
absorption spectroscopy (CVAAS) and for Sb, As, Ba, Be, Cd, Cr, Co, Cu, Pb, Mn, Ni, P, Se,
Ag, Tl, and Zn by inductively coupled argon plasma emission spectroscopy (ICAP) or atomic
absorption spectroscopy (AAS). Graphite furnace atomic absorption spectroscopy (GFAAS) is
used for analysis of Sb, As, Cd, Co, Pb, Se, and Tl if these elements require greater analytical
sensitivity than can be obtained by ICAP. If one so chooses, AAS may be used for analysis of all
listed metals if the resulting in-stack method detection limits meet the goal of the testing
program. Similarly, inductively coupled plasma-mass spectroscopy (ICP-MS) may be used for
analysis of Sb, As, Ba, Be, Cd, Cr, Co, Cu, Pb, Mn, Ni, Ag, Tl and Zn.
For more information and documents about Method 29, please consult the EPA’s Method 29 webpage.
Apex Instruments offers a Method 29 Sampling System. If interested in Method 29 sampling, Apex Instruments works with our customers to make sure we are providing the correct products for your project and will provide you with a price quote. For any questions about our sampling system, please contact sales@apexinst.com.
What is Method 201A?
You can use this method to obtain particle sizing at 10 micrometers and or 2.5 micrometers if you sample within 80 and 120 percent of isokinetic flow. To measure PM10 and PM2.5, extract a sample of gas at a predetermined constant flow rate through an in-stack sizing device. The particle-sizing device separates particles with nominal aerodynamic diameters of 10 micrometers and 2.5 micrometers. To minimize variations in the isokinetic sampling conditions, you must establish well-defined limits. After a sample is obtained, remove uncombined water from the particulate, then use gravimetric analysis to determine the particulate mass for each size fraction. The original method, as promulgated in 1990, has been changed by adding a PM2.5 cyclone downstream of the PM10 cyclone. Both cyclones were developed and evaluated as part of a conventional five-stage cascade cyclone train. The addition of a PM2.5 cyclone between the PM10 cyclone and the stack temperature filter in the sampling train supplements the measurement of PM10 with the measurement of PM2.5. Without the addition of the PM2.5cyclone, the filterable particulate portion of the sampling train may be used to measure total and PM10emissions. Likewise, with the exclusion of the PM10 cyclone, the filterable particulate portion of the sampling train may be used to measure total and PM2.5 emissions.
For more information and documents about Method 201A, please consult the EPA’s Method 201A webpage.
Apex Instruments offers a Method 201A Sampling Kit. If interested in Method 201A sampling, Apex Instruments works with our customers to make sure we are providing the correct products for your project and will provide you with a price quote. For any questions about our sampling kit, please contact sales@apexinst.com.
What is Method 0061?
Method 0061 Hexavalent Chromium Emissions from Stationary Sources determines hexavalent chromium emissions from hazardous waste incinerators, municipal waste incinerators, municipal waste combustors and sewage sludge incinerators.
For incinerators and combustors, the Cr emissions are collected isokinetically from +6
the source: To eliminate the possibility of Cr reduction between the nozzle and impinger, the
+6 emission samples are collected with a recirculatory train where the impinger reagent is continuously recirculated to the nozzle. Recovery procedures include a post-sampling purge and filtration. The impinger train samples are analyzed for Cr by an ion chromatograph equipped with a post-column +6 reactor and a visible wavelength detector. The IC/PCR separates the Cr as chromate (CrO ) from +6 = 4 other diphenylcarbazide reactions that occur in the post-column reactor. To increase sensitivity for trace levels of chromium, a preconcentration system may also be used in conjunction with the IC/PCR.
For more information and documents about Method 0061, please consult the EPA’s Method 0061 webpage.
Apex Instruments offers a Method 0061 Impinger Train. If interested in Method 0061 sampling, Apex Instruments works with our customers to make sure we are providing the correct products for your project and will provide you with a price quote. For any questions about our impinger train, please contact sales@apexinst.com.
What is Method 2?
The average gas velocity in a stack is determined from the gas density and from
measurement of the average velocity head with a Type S (Stausscheibe or reverse type) pitot
tube.
For more information and documents about Method 2, please consult the EPA’s Method 2 webpage.
Apex Instruments offers a Method 2 Pre-Test Survey Kit. If interested in Method 2 sampling, we work with our customers to make sure we are providing the correct products for your project and will provide you with a price quote. For any questions about our survey kit, please contact sales@apexinst.com.
What is Other Test Method 45 (OTM-45)? What is PFAS?
This method identifies and determines the concentration in mass per unit gas volume sampled of
specific PFAS compounds in source emissions. Gaseous and particulate bound target pollutants
are withdrawn from the gas stream isokinetically and collected in the sample probe, on a glass
fiber or quartz filter, on a packed column of adsorbent material and in a series of impingers. The
target compounds are extracted from the individual sample collection media. The OTM-45 train
results in four (4) discreet sample extract fractions for analysis. The extracts are analyzed by LCMS/MS in the MRM detection mode. Quantification of each analyte is calculated using the
isotope dilution technique. For QC purposes, the percent recoveries of the pre-extraction
standards are calculated using the integrated peak areas of pre-analysis standard(s), which are
added to the final extract and function as traditional internal standards, exclusively applied to the
pre-extraction standards. The use of pre-sampling standards added to XAD-2 collection media
prior to sampling and analyzed in the same manner as targeted PFAS compounds serves as an
indication of the methodΓÇÖs quantitative capture efficiency. This method is not intended to
differentiate between target compounds in particle or vapor fractions. This method uses
isotopically labeled standards to improve method accuracy and precision.
For more information and documents about OTM-45, please consult the EMC Other Test Methods directory.
On March 16, 2022, the U.S. Environmental Protection Agency (EPA) announced two important actions to safeguard communities from products containing Per- and Polyfluoroalkyl Substances (PFAS).
- First, as part of EPAΓÇÖs effort to identify, understand and address PFAS contamination leaching from fluorinated containers, the agency is notifying companies of their obligation to comply with existing requirements under the Toxics Substances Control Act (TSCA) to ensure unintentional PFAS contamination does not occur.
- The agency will also remove two PFAS from its Safer Chemical Ingredients List (SCIL) following a review of these substances (which were added to that list in 2012).
ΓÇ£TodayΓÇÖs action will help ensure that responsible parties are held accountable for any future PFAS contamination affecting communities,ΓÇ¥ said Assistant Administrator for the Office of Chemical Safety and Pollution Prevention Michal Freedhoff. ΓÇ£Additionally, keeping PFAS out of consumer products certified under the agencyΓÇÖs Safer Choice program will help prevent potential exposures to PFAS from occurring in the first place.ΓÇ¥
Read more from this EPA notice.
Apex Instruments offers a PFAS Sampling System. If interested in PFAS sampling, we work with our customers to make sure we are providing the correct products for your project and will provide you with a price quote. For any questions about our sampling system, please contact sales@apexinst.com.
What is Method 26?
An integrated sample is extracted from the source and passed through a prepurged heated
probe and filter into dilute sulfuric acid and dilute sodium hydroxide solutions which collect the
gaseous hydrogen halides and halogens, respectively. The filter collects particulate matter
including halide salts but is not routinely recovered and analyzed. The hydrogen halides are
solubilized in the acidic solution and form chloride (Cl−), bromide (Br−), and fluoride (F−) ions.
The halogens have a very low solubility in the acidic solution and pass through to the alkaline
solution where they are hydrolyzed to form a proton (H +), the halide ion, and the hypohalous
acid (HClO or HBrO). Sodium thiosulfate is added in excess to the alkaline solution to assure
reaction with the hypohalous acid to form a second halide ion such that 2 halide ions are formed
for each molecule of halogen gas. The halide ions in the separate solutions are measured by ion
chromatography (IC).
For the isokinetic version of this method, please refer to Method 26A.
For more information and documents about Method 26, please consult the EPA’s Method 26 webpage.
Apex Instruments offers a Method 26 Extension Kit. If interested in Method 26 sampling, Apex Instruments works with our customers to make sure we are providing the correct products for your project and will provide you with a price quote. For any questions about our extension kit, please contact sales@apexinst.com.
What is Method 0040?
Method 0040 is designed, using gas sampling bags, for sampling principal organic hazardous constituents from combustion sources like hazardous waste incinerators. This non-isokinetic Method uses a constant or proportional sampling rate dependent upon the extent and variability of the emission flow rate (Method 2).
A representative sample is drawn from a source through a heated sample probe and
filter. The sample then passes through a heated 3-way valve and into a condenser where the
moisture and condensable components are removed from the gas stream and collected in a trap. The sample is collected in a Tedlar® bag held in a rigid, air-tight opaque container. The dry gas sample and the corresponding condensate are then transported together to a GC/MS. A mass spectrometer is most suited for the analysis and quantitation of complex mixtures of volatile organic compounds. The total amount of the analyte in the sample is determined by summing the individual amounts in the bag and condensate. A flow chart of the procedure is given at the end of this method.
For more information and documents about Method 0040, please consult the EPA’s Method 0040 webpage.
Apex Instruments offers a Method 0040 Sampling Kit. If interested in Method 0040 sampling, We work with our customers to make sure we are providing the correct products for your project and will provide you with a price quote. For any questions about our sampling kit, please contact sales@apexinst.com.
What is Method 6?
A gas sample is extracted from the sampling point in the stack. The SO2 and the sulfur
trioxide, including those fractions in any sulfur acid mist, are separated. The SO2 fraction is
measured by the barium-thorin titration method.
For more information and documents about Method 6, please consult the EPA’s Method 6 webpage.
Apex Instruments offers a Method 6 Sampling Kit. If interested in Method 6 sampling, Apex Instruments works with our customers to make sure we are providing the correct products for your project and will provide you with a price quote. For any questions about our sampling kit, please contact sales@apexinst.com.
Stack Testing Tips
Static Pressure
The easiest way to measure static pressure is to insert a piece of metal tubing connected to a U-tube water-filled manometer into the approximate middle of the stack, with the other end open to atmosphere. If the manometer deflects toward the stack, record this as negative static pressure (less than barometric pressure). If the manometer deflects away from the stack, record this as positive static pressure. If you are using an inclined manometer, then place the connection to the tubing on the negative (right-hand) side of the manometer to read a negative static pressure. Switch it to the positive (left-hand) side to read a positive static pressure. The procedure is identical when using a stack static tap.
Gear Up for Winter with Insulated Blankets
When cooler weather approaches, sampling trains will require extra protection. One of the most common cold-weather challenges for stack testers is effectively maintaining the temperatures of their heated trains. Temperatures falling below the EPA directive can jeopardize the integrity of the sample runs. Insulated blankets are an easy, cost-efficient way of protecting sampling trains against the elements. We offer specially crafted insulated blankets to protect the most vulnerable spots of your sample train against the cold.
Glass Impinger
Although glass impingers are typically used as the condenser section in Method 4 and other isokinetic methods, you can replace them with a stainless-steel equivalent coil condenser, which results in a rugged and reliable system without the fragility of the traditional glass assembly. Note that this assembly can only be used when analyzing samples for moisture content.
Probe Rinse
Consider using a flask with a socket connector that can be clamped to the ball of the probe to capture the probe rinse. This procedure makes it easier for a single person to recover the probe, it decreases contamination from debris in the environment, and it decreases the likelihood of losing your sample from spills.
Leak Checks
When chasing down a leak, it is a good idea to check common leak areas or to use the ΓÇ£split the system in halfΓÇ¥ method to quickly identify a leak. Splitting a system in half means performing a leak check from the glass train to the console, which allows the stack tester to determine whether the leak is in the front half or the back half of the train. This procedure can be performed again to keep narrowing down the search area for the leak.
Rain
Rainy days are not fun for anyone. If you get caught out in the rain during a stack test, all you need is a plastic oven bag; put your datasheet inside and keep it dry as you write down your results. Another option is to upgrade to our XD-502 and let the console record the data for you.
What is Method 0031?
This method employs a sampling module and meter box to withdraw a 20-L sample of
effluent gas containing volatile organic compounds from a stationary source at a flow rate of 1 L/min, using a glass-lined probe heated to 130 ┬▒ 5EC and a sampling method for volatile organic
compounds (SMVOC) train. The gas stream is cooled to 20EC by passage through a water-cooled condenser and volatile organic compounds are collected on a set of sorbent traps (Tenax®-GC/Tenax®-GC/Anasorb®-747). Liquid condensate is collected in an impinger placed between the two Tenax®-GC traps and the Anasorb®-747 trap. The first and second traps contain 1.6 g of Tenax®-GC each and the third trap (back trap) contains 5.0 g of Anasorb®-747. A total number of sorbent tube sets to encompass a total sampling time of 2 hrs is collected: i.e., if a sampling rate of 1 L/min for 20 minutes is used, a total of six sorbent tube sets will be collected in 2 hr of sampling. Alternative conditions for sample collection may be used, collecting a sample volume of 20 L or less at a flow rate reduced from 1 L/min. (Operation of the SMVOC under these conditions is referred to as SLO-SMVOC.) The SLO-SMVOC may be used to collect 5 L of sample (0.25 mL/min for 20 min) or 20 L of sample (0.5 L/min for 40 min) on each set of sorbent tubes. These smaller sample volumes collected at lower flow rates should be considered when the boiling points of the volatile organic compounds of interest are below 0EC to prevent breakthrough.
For more information and documents about Method 0031, please consult the EPA’s Method 0031 webpage.
Apex Instruments offers a SuperVOST Sampling Kit. If interested in Method 0031 sampling, Apex Instruments works with our customers to make sure we are providing the correct products for your project and will provide you with a price quote. For any questions about our sampling kit, please contact sales@apexinst.com.
What is Method 7?
A grab sample is collected in an evacuated flask containing a dilute sulfuric acid-hydrogen
peroxide absorbing solution, and the nitrogen oxides, except nitrous oxide, are measured
colorimetrically using the phenoldisulfonic acid (PDS) procedure.
For more information and documents about Method 7, please consult the EPA’s Method 7 webpage.
Apex Instruments offers a Method 7 Sampling Kit. If interested in Method 7 sampling, Apex Instruments works with our customers to make sure we are providing the correct products for your project and will provide you with a price quote. For any questions about our sampling kit, please contact sales@apexinst.com.
What is Method 18?
The major organic components of a gas mixture are separated by gas chromatography (GC) and
individually quantified by flame ionization, photoionization, electron capture, or other
appropriate detection principles. The retention times of each separated component are compared
with those of known compounds under identical conditions. Therefore, the analyst confirms the
identity and approximate concentrations of the organic emission components beforehand. With
this information, the analyst then prepares or purchases commercially available standard
mixtures to calibrate the GC under conditions identical to those of the samples. The analyst also
determines the need for sample dilution to avoid detector saturation, gas stream filtration to
eliminate particulate matter, and prevention of moisture condensation.
For more information and documents about Method 18, please consult the EPA’s Method 18 webpage.
Apex Instruments offers a M180 VacBag Sampler System, which takes an integrated gas sample in accordance with the U.S. EPA Method 18. If interested in Method 18 sampling, Apex Instruments works with our customers to make sure we are providing the correct products for your project and will provide you with a price quote. For any questions about our sampler system, please contact sales@apexinst.com.
What is Isokinetic Sampling?
-
- Iso = Uniform, same, equal, or similar
- Kinetic = Pertaining to motion
- Uniform sampling of particles and gases in motion within a stack
- Why is isokinetic sampling carried out?
- To provide an unbiased, representative assessment of the quantity of particulate matter emitted from a source, stack, or vent.
- ΔH = K x Δp
- The relationship between vs and vn is the core understanding of isokinetic sampling
- Reading Δp from the pitot tube and setting the proper ΔH (based on stack conditions and K-factor) on the meter box allows the operator to sample isokinetically
Basic Terminology
- Pmrs = Cs x Qs
- Concentration (Cs)
- Quantity of pollutant per volume of effluent gas (grams/cubic meter)
- Stack gas flow rate (Qs)
- Volume of effluent gas per length of time (cubic meters/hour)
- Pollutant mass rate equation (Pmrs)
- Volume of pollutant gas per length of time (grams/hour)
Isokinetic Sampling and Bias
- To obtain average pollutant concentration, these parameters are needed:
- Quantity of mass emitted from stack
- Total quantity of volume from stack
- Isokinetic sampling provides best approach for accurate data
- Pollutant mass rate (pmr)
- pmra (Ratio-of-areas: An ratio As)
- pmrc (Ratio-of-concentration: mn ratio An)
Monitoring Stack Emissions
- Government and industry-oriented purposes:
- Assessment of current performance (compliance)
- Optimization of plant performance
- Choice of abatement techniques (scrubbers, baghouses, etc.)
- Validation of abatement equipment performance
- Assessing regulatory requirements (setting emission limits)
- Providing data for health risk assessments
Isokinetic Sampling:
Application of 5
US EPA Sampling Methods
- Method 1 ΓÇô Sample and Velocity Traverses from Stationary Sources
- Method 2 ΓÇô Determination of Stack Gas Velocity and Volumetric Flow Rate
- Method 3 ΓÇô Gas Analysis for Carbon Dioxide, Oxygen, Excess Air, and Dry Molecular Weight
- Method 4 ΓÇô Determination of Moisture Content in Stack Gases
- Method 5 ΓÇô Determination of Particulate Emissions from Stationary Sources
For more information, please refer to our Isokinetic Presentation or the EPA’s website. Additionally, we have an Intro to Isokinetic Sampling video on our YouTube channel.
What is Particulate Matter? (PM)
Particulate matter refers to very small solid and liquid particles in the atmosphere. There are numerous natural and anthropogenic (man-made) sources.
PM ia hazardous to human health ΓÇô acute and chronic effects to the respiratory and cardiovascular systems (mortality, morbidity, health care).
There are larger effects on those with asthma, existing heart or lung diseases, senior citizens, young children, and those who work outdoors.
For more information about particulate matter and PM pollution, please visit the EPA’s Particulate Matter Pollution webpage.
Intro To Source Sampling
The primary purpose of industry performance monitoring is to provide information to the plant operator. This allows the operation of a plant to an adequate level of pollution control and assessment of compliance with the discharge license. In addition, the data can be useful in the design and implementation of clean technology systems and to assist with identifying waste minimization opportunities. Most often this will involve sampling from a stack or other designated discharge point and determining the characteristics of the emission gas stream. Performance monitoring should provide timely, reliable and accurate information regarding the composition and rate of emission of waste to the environment. This will enable non-compliance with license conditions to be promptly acted upon. These objectives can only be achieved if sampling and analysis methods are of a high standard.
The objective of sampling is to ensure that the sampled gas stream is representative of either the total or a known portion of the source emissions. Unfortunately there is no single sampling method to cope with the variable and complex nature of source emissions. This section provides information and general guidance on aspects of sampling that must be considered prior to embarking on a sampling program.
Sampling and analysis of air emissions requires special expertise and must be undertaken by trained personnel. It is most important that sampling personnel are trained and familiar with methods of obtaining representative samples, their handling and preservation, requirements of the analysis and any sampling and analysis limitations and importantly, safety issues. This applies whether an employee of the licensee is undertaking the sampling or a consultant laboratory has been contracted to do the work. A detailed knowledge of the operation of the source(s) and any associated air pollution control devices is also important in obtaining a representative sample of the gas stream. The choice of measurement methods needs to be compatible with the objectives of the monitoring program.
Whenever sampling, monitoring or field measurements are undertaken it must be done within the framework of a well-documented quality system. This applies whether the analyzing laboratory is responsible for the sampling, the license holder monitors its own wastes or another organization is contracted to conduct sampling. The license holder must ensure that sampling location, provisions and access meet the minimum requirements detailed in this guide.
In some circumstances, the sampling location on a stack may not meet the minimum requirements because of existing design limitations. When this occurs, license holders should contact EPA to determine whether test results from non-complying sampling locations will be acceptable or an alternative is required.
Stationary source sampling is the experimental process for evaluating the characteristics of industrial waste gas stream emissions into the atmosphere. Materials emitted to the air from these sources can be solid, liquid, or gas; organic or inorganic. The effluent pollutants emitted to the atmosphere from a source may contain many different pollutant materials. The quantity and type of each pollutant must be known so a control strategy can be formed.
SOURCE SAMPLING FOR PARTICULATE EMISSIONS: Source sampling methods are used to determine emission compliance with regulatory statutes. Source testing provides data on the pollutant emission rate. Test data are also used to evaluate the best available control technology.
The sampling system measures a number of variables at the source while extracting from the gas stream a sample of known volume. The information on source parameters in conjunction with quantitative and qualitative laboratory analysis of the extracted sample makes possible calculation of the total amount of pollutant material entering the atmosphere. These data are important for controlling pollutant emissions, evaluating source compliance with regulations or providing information upon which control regulations will be based.
The industry performing source sampling gains information on the operation of the process tested. The sampling of source emissions gives valuable process data, which can be used to evaluate process economics and operation control. Information gathered during a source test experiment may also be used for determining existing control device efficiency or for designing new process and emissions control equipment.
The typical industrial process may vary conditions at the source for a variety of economic or logistical reasons. The source sampling experiment must be designed to prevent process variation from biasing the source sample. The test engineer has the additional problems of carrying out an important experiment under extremely difficult working conditions. These problems make source testing an endeavor that should be performed only by trained personnel.
The guidelines must be followed whenever testing or monitoring is undertaken for any purpose required by the Environment Protection Act of 1970. The guidelines will also be invaluable to any company or agency that wishes to obtain an accurate assessment of the impact of its activities on the environment.
This guide is a companion document to A Guide to the Sampling and Analysis of Waters, Wastewaters, Soils and Wastes (EPA Publication 441)
From Australian Manual – 440
Why Are Source Emissions Monitored?
There are several possible reasons why stationary source emissions or ambient air quality are to be monitored:
ΓùÅ to comply with requirements of EPA licenses or works approvals or a Neighborhood Environment Improvement Plan,
ΓùÅ to determine the concentrations of pollutants in the environment or entering the environment from a specific source,
ΓùÅ to measure the efficiency of pollution control equipment,
ΓùÅ to allow process operators to control their processes within prescribed limits and to achieve optimum process efficiency,
ΓùÅ to provide data for emission inventories,
ΓùÅ to assess the impacts of improvement strategies on the local environment, and
ΓùÅ to address environmental responsibilities as well as responsibility as a member of the local community.
What Are The Steps Of a Monitoring Program?
The critical steps in any monitoring program (either source emission or ambient air) include, but are not restricted to:
ΓùÅ determining the objectives of the program,
ΓùÅ assessing a suitable sampling location or monitoring site,
ΓùÅ deciding on the measurements to be made (if not pre-stipulated),
ΓùÅ selecting an approved measurement method and appropriate equipment,
ΓùÅ obtaining representative samples,
ΓùÅ ensuring that the integrity of the sample is maintained prior to its presentation to the analytical device,
ΓùÅ documenting key steps in the sampling and analytical processes, including:
Γùï labeling of samples to be analyzed,
Γùï recording process conditions related to emission source samples,
Γùï maintaining logs of instrument and equipment operating conditions,
Γùï analyzing the samples or sampled air accurately and precisely following approved analytical methods, and
Γùï reporting results accurately and completely, and where appropriate providing informed interpretation of the results.
Most industrial operations have variable process conditions which change the characteristics and quantities of pollutants discharged to the environment. With care, these difficulties can be minimized and acceptable results produced.
Periodic Emissions Monitoring vs. CEM
One issue that comes up frequently for both new and existing plants is whether to conduct periodic monitoring or to implement a continuous emissions monitoring (CEM) system. The issue depends not only on the particular air permit for each plant but also on several practical factors.
For large emission sources, continuous emission monitoring may be required to provide a detailed record of emissions over time. In other circumstances, periodic testing may be sufficient, but this may also be needed to provide a check on the results produced from continuous monitoring.
Conclusion
Periodic monitoring techniques may seem to provide the required service at a lower cost. However, for many applications the use of periodic emissions monitoring cannot meet the requirements of todayΓÇÖs air permits. On the other hand, many facilities are now explicitly required to implement and maintain continuous emissions monitoring strategies as part of their basic air permits and environmental regulations. When deciding on an emissions monitoring strategy decision makers should take care to consider all of their compliance requirements as well as any additional benefits to be had from using CEM vs a periodic monitoring strategy.
What Is Periodic Monitoring?
This method involves taking readings of PM concentrations at regular intervals. Periodic monitoring can be done either automatically or manually. Automatic monitoring uses devices that capture a reading at a fixed interval and then return a result. Manual systems usually involve the taking of samples to be analyzed later in a lab, where results can take minutes or days to receive. Some samples are taken over a fairly short period of time (few seconds) others may be taken over longer periods of time such as hours or days in order to establish a larger average emissions level.
EPA Method 5 is one form of stack testing that can be done an outside firm at regularly intervals as required by a facilityΓÇÖs air permit. Other examples of visual periodic testing currently in use for particulate emissions include EPA method 9 and 22 where a trained person conducts a visual inspection test of the stack to determine opacity levels emitted from the stack.
What is Continuous Emissions Monitoring? (CEM)
This method uses fixed instruments to continually take readings during normal operation. These systems can take the form of CEMs, which continually measure particulate concentration levels in the gas stream. Examples of this kind of system include opacity meters and triboelectric dust detection systems which provide a relative indication of the amount of particulate either through an opacity level or a pico amp signal. Some other systems also make use of continuous sampling, whereby a sample is continually extracted from the air stream for analysis, such as chemiluminescence analyzer for measuring NOx, or a Beta Gauge for particulate sampling. Other systems are used as arrestment failure CEMs, or failure alarms that trigger when a required level is no longer met. Examples of this include broken bag detectors (Both opacity based and certain triboelectric based systems) that trigger alarms when a sudden spike above acceptable emissions levels is detected.
What Are The Advantages of Continuous Emissions Monitoring over Periodic Measurements?
Periodic readings generally become less effective the more variable the emissions or process conditions. In these cases where intermittent sampling would be unrepresentative, or would be required too frequently to be practicable, a continuous emissions monitoring system makes the most sense. In addition, many applications that utilize dust collection systems for control of particulate matter emissions will find that periodic sampling will not meet the stringent requirements of modern air permits or compliance regulations. Periodic sampling may prove impractical from an operational perspective as well. Data gathered from continuous emissions monitoring helps improve operations and enable predictive maintenance planning that can lead to additional cost savings.
(WIP) Continuous Emission Monitoring for Particles
(link to relevant manual section and associated sampling products)
There are a variety of continuous monitoring techniques for particles, these include methods that are based on light absorption, light scattering, charge transfer and beta attenuation techniques. To establish a calibration function between the particle monitoring system output and mass concentration, a series of manual stack tests using an approved method, for example Australian Standard 4323.2 (1995) – what is the U.S. equivalent? should be performed over a range of emission rates and process conditions.
The mean value of the CEM output measurements are correlated with the corresponding results from the manual stack tests to derive a calibration function for the particle monitoring equipment. An appropriate field evaluation test program for the development of a calibration function between an automated particle monitoring system and a manual gravimetric test method is described in the International Standard 10155 (1995) – link?.
(WIP) Helpful Tips on Sampling Program Design
Planning a source emission test program requires that the objectives be clearly defined to ensure that the data will meet the stated objectives. Designing an adequate sampling program requires a good knowledge and understanding of the system to be sampled. The data user, sampling team and staff from the analyzing laboratory should be involved in the planning stage if the program is to be successful.
The following information should be acquired prior to sampling and testing:
ΓùÅ detailed information on the process conditions,
ΓùÅ the process conditions under which the test is required,
ΓùÅ the location of the sampling plane,
ΓùÅ provision of access holes and safe working platform,
ΓùÅ selection of the number of sampling points,
ΓùÅ safe access to the area,
ΓùÅ suitable sampling equipment,
ΓùÅ the availability of sufficiently sensitive and specific methods of analysis, and
ΓùÅ the distance from and capacity of the analytical laboratory.
There are wide variations in process conditions in most industrial plants, which may produce different characteristics and quantities of waste emissions. Strategies for sampling vary depending on whether the process is continuous, cyclic or batch and whether the results are to reflect peak, normal or any other designated plant operating conditions.
In all test situations consideration must be given to:
ΓùÅ fluctuations in velocity, temperature or pollutant concentration due to uncontrollable variation in the process,
ΓùÅ moisture content (particularly wet stack gases),
ΓùÅ expected gas composition and likely interfering compounds,
ΓùÅ high vacuum, high pressure or high temperature gas streams, and corrosive or very reactive components.
From Ron’s Overview:
Before the team deploys for the test, it is important to clarify some practical needs with facility staff, especially the following:
ΓùÅ test ports, their location and accessibility,
ΓùÅ including practical matters like stack diameter so you can select the correct probes,ΓùÅ parking location for the test trailer or truck,
ΓùÅ electrical power availability,
ΓùÅ unit operation and record keeping, and
ΓùÅ communication expectations between the test team and facility staff.
Facility staff also need to understand the responsibilities of the test team, especially:
ΓùÅ setup may be a matter of a few hours, to the better part of the day depending on the complexity of the test;
ΓùÅ communication requirements with the facility need to be clear early in the process, and reiterated before the team begins the test program;
ΓùÅ sampling schedule needs to be clear, facility staff need to know not only at what rates to operate their processes, but for how long;
ΓùÅ laboratory analysis timeline; and
ΓùÅ reporting timeline.
EPA rules or state permits frequently place hard deadlines on report submission. It is best to keep clients informed throughout the process about the overall project timeline.
Follow-up may be necessary in a number of situations:
ΓùÅ If a test shows that a facility is not in compliance a retest will be necessary, and possibly a preliminary set of tests to help the facility adjust parameters to ensure compliance.
ΓùÅ If regulators have questions after the test ΓÇô a phenomenon that may occur several months after the report is issued ΓÇô testing managers need to make themselves available to consult and to answer technical questions.
ΓùÅ Accreditation may be a requirement for testing companies under some circumstances ΓÇô particularly when conducting tests under Part 75 regulations, which apply to larger electric power generating facilities. This also is an expansive topic by itself, and one of which testers should be aware.
(WIP) Continuous Emission Monitoring for Organic Compounds
(link to relevant manual section and associated sampling products)
The most common methods of continuously monitoring organic compounds are either chromatographic or spectrometric.
The chromatographic system samples a portion of the stack effluent and delivers it either to a chromatographic system or directly to a flame ionization detector (FID). If no chromatographic separation of compounds occurs, the low molecular weight hydrocarbons such as methane, propane etc., as well as other volatile organic compounds are measured by the detector as a single total response.
The continuous analyzer is normally calibrated against a methane or propane calibration gas and the results are expressed as parts per million carbon equivalents, although it is possible to calibrate the continuous monitor directly against a compressed gas standard, e.g. hexane.
Note: For FIDs, the effect of the oxygen concentration of the monitored stack gas must be assessed. This effect can be reduced by using zero and span gas with the same oxygen concentration as the stack gas.
Spectrometric systems typically use differential optical absorption spectroscopy or Fourier transform infrared spectroscopy techniques to monitor individual organic compounds within the discharge.
Do we want to include information on sampling ambient air, from the Australian manual?
Calibrating New Equipment
Commissioning of new equipment should include routine 24-hour zero and span cycles to demonstrate instrument stability.
Calibration frequency may be relaxed to weekly following demonstration of satisfactory instrument stability. Instrument linearity checks are required on a six-monthly basis or after significant maintenance.
Standard gases must have traceability to National Institute of Standards and Technology (NIST) standards, and should be replaced or re-calibrated within two years of the initial certificate calibration date.
Apex Instruments offers Calibration Services for your stack testing equipment.
(WIP) What Are The Documentation Standards For Stack Testing?
For all monitoring or testing, a documented quality system is required. This would include:
ΓùÅ Written procedures for the work undertaken,
ΓùÅ An outline of the training provided to staff who will operate the procedures,
ΓùÅ A description of the processes employed to check the quality of results, and
ΓùÅ Procedures to be used in the event that the quality control checks identify a problem with the sampling and analysis.
ΓùÅ For each analyzer, a separate logbook (or equivalent) must be maintained, recording all relevant data related to the instrument.
ΓùÅ Chart records of the instrument output must be labeled on inspection with the time, date and operator’s initials.
ΓùÅ Data records and logbooks must be kept for at least three years.
ΓùÅ Quality assurance and quality control procedures must meet the minimum requirements contained in Appendix B (link to the info contained in this appendix?).
(WIP) How Do I Prepare Test Equipment?
Test Equipment must be assembled and checked in advance. It should be calibrated following procedures recommended in the Code of Federal Regulations and this manual (<– what manual?). The entire sampling system should be assembled as intended for use during the sampling experiment. This ensures proper operation of all the components and points out possible problems that may need special attention during the test.
This procedure will assist the test firm in making preparations and planning for spare parts. The equipment should then be carefully packed for shipment to the sampling site.
The proper preparation of sampling train reagents is an important part of getting ready for the sampling experiment. For example, the EPA Method 5 sampling train requires well-identified pre-cut glass mat filters that have been desiccated to a constant weight. The tare weights must be recorded to ensure against errors. Each filter should be inspected for pinholes that allow particles to pass through. The acetone or other reagents used to clean sampling equipment must be a low-residue, high-purity solvent stored in glass containers. Silica gel desiccant should be dried at 250-300 degrees Fahrenheit for two hours, checked for indicator decomposition (recognized by black color) and stored in air-tight containers.
Source Sampling Checklist
Γ¼£ Conduct a preliminary site visit.
Γ¼£ Select an approved method and sampling equipment.
Γ¼£ Observe all safety precautions.
Γ¼£ Ensure plant is operating according to test requirements.
Γ¼£ Adhere to requirements of sampling method.
Γ¼£ Transport samples to laboratory as soon as practicable ensuring complete sample identification and description.
Γ¼£ Emission monitoring systems must be evaluated for performance.
Visit the EPAΓÇÖs Air Emission Measurement Center (EMC) to obtain detailed information on test methods for measuring pollutants from smokestacks and other industrial sources. The EMC website compiles the variety of test methods available for emission measurement.
(WIP) Health and Safety Precautions
The risks associated with stack sampling must be carefully assessed prior to commencement of sampling. Appropriate risk management steps must be put in place. The risks may arise from any number of hazards associated with the tasks to be done and the physical conditions prevailing.
Some of the hazards involved include:
ΓùÅ working at height or on temporary platforms,
ΓùÅ exposure to toxic, corrosive or hot gases,
ΓùÅ electrical hazards,
ΓùÅ trip hazards from cables,
ΓùÅ noise or heat from plant equipment,
ΓùÅ objects falling from work platform or into the duct, and
ΓùÅ flammability hazards.
When the sampler(s) are not employees of the organization occupying the site, site management should be notified of impending tests and information sought on the siteΓÇÖs safety policy and details of:
ΓùÅ requirements for safety work permits,
ΓùÅ location of emergency equipment and safety signs,
ΓùÅ location of refuge areas or muster points, and
ΓùÅ reporting procedures in the event of safety problems.
All site safety procedures should be followed and the organization should work to maintain a culture where safety is everyoneΓÇÖs responsibility. If the sampler assesses that there is unacceptable risk involved in taking samples, the testing should not proceed and site management should be advised.
Do you want to add information here on ΓÇ£Common Causes of AccidentsΓÇ¥ and ΓÇ£Accident PreventionΓÇ¥? (I screenshotted some text on these topics from the ΓÇ£Source Sampling Workshop NotebookΓÇ¥ pg. 176, in BillΓÇÖs office).
(WIP) Emission Sampling Methods 1-5 Overview
(link to relevant manual section and associated sampling products)
A manual sampling program shall consist of a minimum of two test runs per pollutant with minimum sampling times specified in Table 1. The minimum sampling times do not apply to variable or batch processes. These cases may require sampling during an entire cycle or taking sufficient samples to characterize the gas stream to meet the objective of the sample program.
Virtually all stack tests require, as a minimum, the measurement of the following parameters to enable the calculation of mass emission rates of the waste in the discharge:
ΓùÅ gas velocity,
ΓùÅ gas pressure and temperature,
ΓùÅ gas composition and density (also known as molecular weight?)
ΓùÅ moisture, and
ΓùÅ volumetric flow rate.
Helpful Terms (Velocity, Molecular Weight, Moisture)
Velocity
As we discussed a moment ago, measuring velocity is a critical part of isokinetic sampling.
A pitot tube connected to a manometer is the central device used to make these measurements. This combination measures the pressure difference between a tube facing into the stack gas
flow and one facing away from the stack gas flow. Gas velocity is proportional to the square root of that pressure difference. Molecular weight and gas temperature are also important values for calculating gas velocity.
Molecular Weight
The density of the gas directly affects the pressure it exerts on a pitot probe, so itΓÇÖs important to know that density. We determine it by measuring the major components of stack gas (O2 and CO2 with an assumed balance of N2 in most cases) and calculating ΓÇô or closely estimating – the molecular weight. More about those measurements later.
Moisture
Finally, we need to know how much water vapor is in the stack gas. This for two major reasons. First, most of our measurements of pollutant concentrations are on a dry basis. In the case of isokinetic sampling, we measure total sample gas volume after the sample has been dried by chilling and passing through a desiccant, using a DRY gas meter. Most instrumental test methods, which we will discuss shortly, also measure pollutants in a stack gas sample after it has been chilled to remove moisture.
These moisture measurements are among the simpler tasks in stack testing, and are built into the isokinetic sampling methods. Briefly, a sampling system draws stack gas through a probe and filters through a set of chilled impinger vessels, including one that contains silica gel. The sample gas passes through a dry gas meter to determine total sample volume. The difference between pre-test and post-test impinger weights determines how much moisture was collected. That mass of water is converted to a corresponding vapor volume, which is divided by the total gas volume to determine absolute humidity ΓÇô typically a fractional or percent value.
To minimize the number of variables, tests should be conducted when there is constant flow through the duct. This should remain constant over the period of the test.
Sample conditioning is generally required to successfully transfer the analyte to the collection medium. This often incorporates filtration, heating, cooling or condensation to maintain the integrity of the sample.
(WIP) Isokinetic Sampling of Emissions for Particles
Isokinetic sampling is an equal or uniform sampling of particles and gases in motion within the stack. Isokinetic source sampling is achieved when the velocity of gas entering the sampling nozzle is exactly equal to the velocity of the approaching gas stream. This provides a uniform, unbiased sample of the pollutants being emitted by the source. Isokinetic source sampling most closely evaluates and defines various parameters in the stack as they actually exist at the time of sampling.
Isokinetic source sampling provides a great deal of important data on the operating parameters and emissions of an industrial stationary source. This information is used as the basis for decisions on a variety of issues. The data taken during a source test experiment must, therefore, be a precise representation of the source emissions.
To perform isokinetic testing, you must have a thorough understanding of the first five test methods presented in Title 40 Part 60 Appendix A of the Code of Federal Regulations (40CFR60 App. A). While Method 5 outlines the general sampling train operation protocol, Methods 1 through 4 prescribe techniques that serve as a foundation for Method 5 sampling activities. Together, these methods outline the basic protocols for determining particulate concentrations and mass emission rates.
You can easily adapt the basic Method 5 sampling train to test for many other gaseous and particulate emissions from stationary sources. Adapting basic test methods allow you to expand testing to include parameters of interest such as metals, polychlorinated biphenyls (PCBs), dioxins/furans, polycyclic aromatic hydrocarbons (PAHs), particle size distributions and an ever-increasing group of other pollutants.
While the different methods are designated by other US EPA method numbers, they actually are variations of Method 5 procedures. Variations might include using different impinger solutions, organic resin traps, different filter media, various sampling temperatures, or a range of other alternative procedures.
System Description
The first step to successful sampling is to familiarize yourself with the standard equipment. To illustrate the necessary components of source sampling, weΓÇÖve included a diagram of the five main components of the Apex Instruments Isokinetic Source Sampling Equipment, shown in Figure 1-1:
1. Source Sampler Console, which includes a dual-column manometer, sample flow control valves with orifice flow meter, dry gas meter, and electrical controls. The Console is housed in a weather-resistant ultra-high molecular weight (UHMW) polyethylene custom-designed case complete with carry strap.
2. External Sample Pump Vane or Dual Diaphragm, including hoses with quick-connect fittings and lubricator.
3. Probe Assembly includes a stainless-steel probe sheath, probe liner, tube heater, Type-S pitot tubes, stack and heater Type K thermocouples, and an Orsat line.
4. Modular Sample Case includes hot box for filter assembly, cold box for impinger glassware and electrical connections.
5. Umbilical Cable includes electrical and pneumatic lines to connect the Modular Sample Case to the Sample Pump and Source Sampler Console.
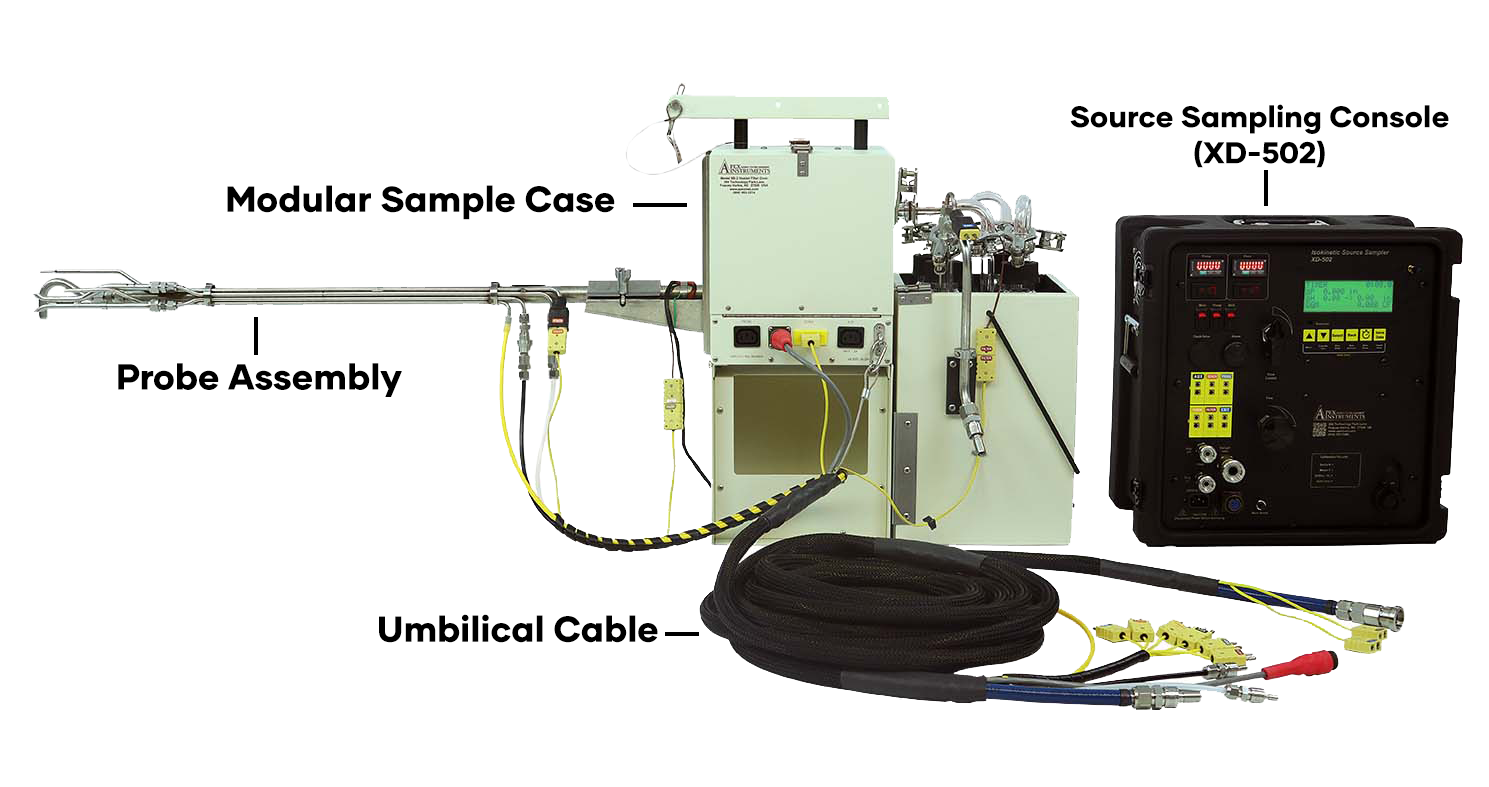
Figure 1-1
(next paragraphs from RonΓÇÖs overview)
Generally, the operator performs multi-point sampling at selected points across the sampling plane. The number of points is dependent upon the cross-sectional area of the stack and distance of the sampling plane from flow disturbance within the stack (refer AS4323.1).
The degree to which a sample represents the particles in the total gas flow depends on:
ΓùÅ homogeneity of the gas velocity within the sampling plane,
ΓùÅ sufficient sampling points used across the sampling plane, and
ΓùÅ the maintenance of isokinetic sampling conditions.
For some industries, consideration must be given to the temperature of the discharge and the effect that conditioning at 105┬▒5┬░C may have on the collected particulate matter.
Typical EPA Reference Test Methods and Corresponding Pollutants
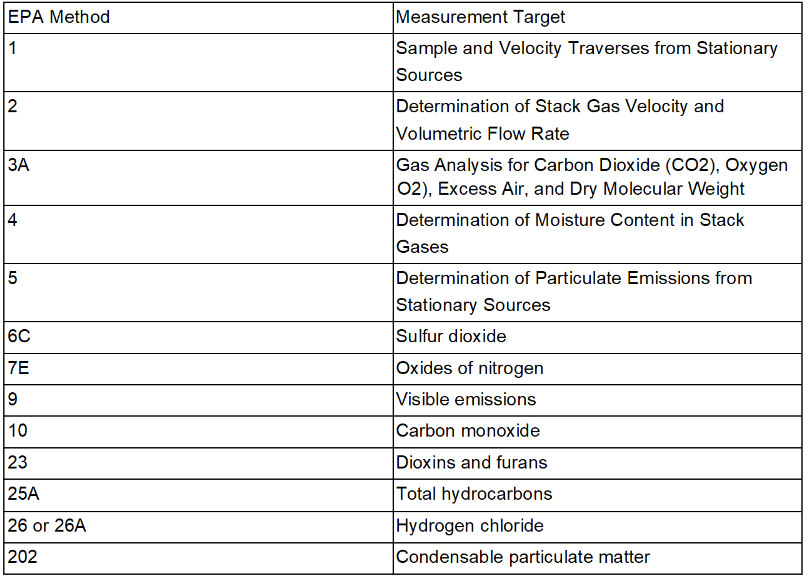

What is Method 1?
This method is designed to aid in the representative measurement of pollutant emissions and/or total volumetric flow rate from a stationary source. A measurement site where the effluent stream is flowing in a known direction is selected, and the cross-section of the stack is divided into a number of equal areas. Traverse points are then located within each of these equal areas.
It is important to determine exactly where in the stack to collect samples before diving into the analytical methods. EPA Method 1 is how the stack tester:
ΓùÅ selects an appropriate sampling location,
ΓùÅ determines the required number of sampling points, and
ΓùÅ calculates the location of the sampling points within the duct.
With a circular stack, in an ideal situation, test ports would be located at least 8 diameters from any upstream flow disturbance, and at least 2 diameters from any downstream disturbance or stack exit. A sample is collected at points along two perpendicular axes. Each point is located such that the cross-section ring that it represents has an area equal to all of the other cross-section rings.
In a rectangular duct, the sample points are set up in a grid configuration. Keep in mind that sampling locations that are increasingly far away from the ideal 8-and-2 diameters situation require increasing numbers of sample points.
For more information, please visit the EPA’s Method 1 Webpage.
What is EPA Method 2?
EPA Method 2 applies to measurement of the average velocity of a gas stream with a pitot. The average gas velocity in a stack is determined from the gas density and from measurement of the average velocity head with a (Stausscheibe or reverse type) Type S pitot tube.
Velocity traverses are conducted by measuring flow at each sample point determined by the Method 1 calculations for stack gas velocity pressure ( ΔP) and stack temperature (Ts).
The operator takes velocity measurements before conducting a test or while performing a Method 5 test to determine the isokinetic sampling rate at each sample point. Volumetric flows are mathematically adjusted for temperature, pressure, and gas molecular weight.
For more information, please visit the EPA’s Method 2 Webpage.
Equipment Needed for Method 2:
ΓùÅ flow measuring device;
ΓùÅ pitot tube, attached to M5 probe or independent;
ΓùÅ temperature measurement, attached to M5 probe or independent;
ΓùÅ sample line with negative/positive lines and TC passthrough; and
ΓùÅ Apex Instruments Sampling Console/Equipment:
Γùï XD-502
Γùï XC-53
Γùï DPT-B5
What is Method 3?
U.S. EPA Method 3 is used for determining the dry molecular weight and excess air correction factors in combustion sources (O2, CO2, N2, CO). These values help the operator gather preliminary data from the source and use them in calculations such as total volume of gas collected.
The operator can perform the Method 3 sampling using one of three techniques:
ΓùÅ single point grab sample,
ΓùÅ single point integrated sample, or
ΓùÅ integrated multi-point sample.
Equipment Needed for Method 3
Method 3 requires equipment to extract, store, and analyze the sample collected.
To extract the stack contents, the operator needs:
ΓùÅ a Tedlar bag pump or Orsat pump and a probe and sample line (for M5 setup), or
ΓùÅ a Tedlar bag pump, stainless steel tubing for the probe, and Teflon tubing for the sample line (for M4 setup).
ΓùÅ Tedlar bags to store the stack contents.
To analyze the contents, the operator will need:
ΓùÅ an instrumental analyzer, Orsat or Fyrite
For more information about Method 3, please visit the EPA’s Method 3 Webpage.
What is Manual Gas Sampling?
Manual sampling of gases does not have to be done isokinetically. Gas sampling is most often performed at a single flow rate for the entirety of the sample run. While emissions may be filtered, this is often not used in analysis. The sample analysis is performed on ΓÇ£chargedΓÇ¥ impingers for particular analytes.
Multi-point sampling is generally not required for sampling of gaseous emissions. However, in some situations, notably after the junction of several different streams, stratification of the gas stream will persist for some distance downstream. A survey of a suitable constituent of the gas stream, such as carbon dioxide or oxygen, should be performed to determine the degree of stratification.
In cases where stratification does not exist, single point sampling at one quarter the diameter across the stack, should be representative of the gaseous emission. If stratification exists, the gaseous emission determination will require multi-point sampling techniques, unless an alternative sampling plane can be found.
Equipment needed for manual gas sampling:
ΓùÅ Apex Instruments Consoles
Γùï Designed to extract sample gas, monitor temperature sensors, control heat settings for heaters, manage time for sample run, and allow the operator to set and adjust flow rate.
Γùï XC-623
Γùï XC-6
Γùï XC-260
Γùï XC-11
ΓùÅ Umbilical, which connects the console and impinger setup.
Γùï Contains tubing, wire and other connections for sample extraction, temperature monitoring and power supply.
ΓùÅ Sample Collection
Γùï Midget (mini) impingers fill with solutions that capture certain analytes.
Γùï A mixture of sorbents, condensers and traps that remove moisture or capture certain analytes.
Γùï Tedlar bags or a glass flask that is filled with air that is evacuated to draw in sample gas.
ΓùÅ Probe
Γùï Typically contains a borosilicate glass or stainless steel liner that is seamless.
Γùï Can be heated above stack temperature or dew point to avoid condensation.
Γùï May be fitted with a filter to capture particulate matter that could otherwise affect the sample or other downstream equipment.
(WIP) What is Instrumental Gas Sampling?
The U.S. EPA specified Instrumental Reference Methods (IRM) are used to substantiate the accuracy and precision of the Continuous Emission Monitoring System (CEMS). CEMS is the equipment that is used for the determination of a gas or particulate matter concentration or emission rate using pollutant analyzer measurements, conversion equations, graphs, or computer programs to produce results in units of the applicable emission limitation or standard. CEMS are required under some of US EPA regulations for either continual compliance or when one is exceeding the standards.
IRM-associated methods:
ΓùÅ Method 6C Determination of Sulfur Dioxide Emissions from Stationary Sources
ΓùÅ Method 7E Determination of Nitrogen Oxide Emissions from Stationary Sources
ΓùÅ Method 10 Determination of Carbon Monoxide Emissions from Stationary Sources
ΓùÅ Method 25A Determination of Total Gaseous Organic Concentration using a Flame Ionization
Semi-Continuous Emission Monitoring
Instrumental gas analyzers are often used in a semicontinuous (batch) monitoring mode to measure emissions for short periods of time (typically from 1- hour to several days). These systems are not permanently attached to the stack and generally stack gases are withdrawn from the discharge through a gas conditioning system to the instrumental analyzer.
Because of the variety of parameters measured and techniques available in gas analyzers, it is not possible to specify performance specifications for all types of instrumental analysis. However, users must operate equipment according to the manufacturer’s instructions and be familiar with the characteristics of their analyzer for their particular application.
A requirement for instrumental analyzers is that the following performance characteristics are assessed before use:
ΓùÅ response time,
ΓùÅ zero and span drift,
ΓùÅ detection limit,
ΓùÅ effect of interfering substances, and
ΓùÅ effect of temperature and pressure on instrument stability.
Quality assurance and quality procedures for operation of semi-continuous monitoring must meet the requirements contained in Appendix B.
Continuous Emission Monitoring
A continuous emission monitoring system (CEMS) is the total equipment necessary for the determination of a gas or particulate matter concentration or emission rate using instrumental analyzer measurements and a correlation function, graph, or computer program to produce results in units applicable to the emission license requirement.
Some license holders are required to continuously monitor their process emissions. Obtaining a representative sample of the discharge is the most important factor in siting continuous emission monitoring equipment. Guidance is provided in AS 4323.1 (US equivalent?) on appropriate siting locations.
Other factors for installation must also be considered, including accessibility to the monitor and the sampling interface for routine maintenance and calibration.
The size and number of access holes must be sufficient to accommodate the analyzer, as well as allowing parallel measurements against manual standard reference methods
If the monitor is to be located remote from the sampling location, consideration needs to be given to response time, reactivity of sampled analyte, and potential for sample loss.
There are two types of systems for continuous emission monitoring:
ΓùÅ extractive, and
ΓùÅ in-situ.
Extractive systems involve continuous withdrawal of a sample from the gas stream. For gaseous components, the extracted sample gas must be conditioned to prevent condensation and filtered to remove particle contaminants. Some conditioning systems include dilution with dry air to reduce the dewpoint of the sample gas to prevent condensation. An extractive system typically includes the following components:
ΓùÅ in-stack sampling probe,
ΓùÅ coarse in-stack filter,
ΓùÅ sample transport tubing,
ΓùÅ sample pump,
ΓùÅ moisture removal (dilution, refrigerant or diffusion),
ΓùÅ fine filter,
ΓùÅ analyzer calibration system, and
ΓùÅ data recorder.
In-situ monitoring means monitoring pollutants inside the stack under actual stack conditions. The monitoring path may be across the stack or part thereof.
How Do I Sample For Organic Compounds/Emissions?
Sampling Emissions for Organic Compounds
The four environmental issues normally associated with stack emissions of organic compounds are:
ΓùÅ toxicity and potential for detrimental environmental or human health effects,
ΓùÅ odorous properties of the volatile species,
ΓùÅ potential to participate in photochemical reaction to produce oxidants,
ΓùÅ greenhouse gas or ozone-depleting potential.
Emissions of organic compounds to the environment may be in various phases or combinations of phases (solid, liquid or gas). Sampling techniques are therefore governed by the phase(s) of the compounds.
To establish the most appropriate sampling method for determination of organic compounds from emission sources, information on the composition and expected concentration is required. Details of the process operation are also required to establish whether the emission is intermittent, cyclic or continuous.
Selection of an appropriate test method will be based on factors including:
ΓùÅ the chemical composition of the organic compounds emitted,
ΓùÅ the expected concentration range,
ΓùÅ the chemical and physical properties (boiling point, reactivity, solubility etc.), and
ΓùÅ the characteristics of the discharge (temperature, moisture etc.).
When the type and concentration of organic compounds in the discharge are unknown, it is recommended that preliminary sampling and analysis be undertaken to identify and determine approximate concentrations of organic compounds beforehand to facilitate the selection of an appropriate test method. Some of the information can be obtained from literature surveys, plant personnel or previous experience with similar industrial processes.
Sampling Organic Emissions with Solid Sorbents
For multi-phase sampling of organics the common practice is to utilize a filter for solids and a solid sorbent cartridge for vapor-phase organics. This approach is used for sampling of semi-volatile organic compounds in US EPA Method 23 and US EPA SW-846 Method 0010. EPA Method 4230 is generally applicable to hydrocarbons in the boiling point range 36 to 126┬░C and involves collection of a representative sample of stack gas on a solid sorbent tube.
The method should not be used to sample very volatile organic compounds because low molecular weight hydrocarbons such as methane and propane breakthrough the absorption trap and are not measured.
Sampling Organic Emissions with Bags/Containers
If the discharge contains only very volatile gaseous organic compounds, gas samples may be collected in an inert sample container, then analyzed by gas chromatographic techniques. With this sampling and analysis procedure, very volatile organic compounds can be identified and quantified.
Sampling using this technique with subsequent GCFID (gas chromatograph ΓÇô flame ionization detector) or GC-MS (gas chromatography ΓÇô mass spectrometry) analysis is generally used for:
ΓùÅ screening of emissions to identify unknown species, and
ΓùÅ organic compounds that are non-reactive volatile species.
For container samples, analysis must be completed within 48 hours of sample collection. This procedure is generally not applicable to higher molecular weight hydrocarbons due to the potential for loss in the sample container. A recovery evaluation is a mandatory requirement of container sampling. The recovery evaluation will include a spike of similar concentration to the sample and must remain in the container for the same duration that the collected sample was in the container.
Detection Limits and Increasing Pollutant Concentration
Since gas molecules are smaller and lighter than particulates, keep in mind that sampling too quickly can result in under-sampling particulates, while sampling too slowly can result in over-sampling particulates.
Also, if it is known or likely that pollutant concentrations in the stack discharge will be close to the method detection limit (for example, Class 3 indicators) then attempts must be made to increase the pollutant concentration in the collected samples.
There are a number of ways to increase the pollutant concentration above the detection limit including:
ΓùÅ increasing the sample volume,
ΓùÅ concentrating the sample, and
ΓùÅ using more sensitive analytical techniques.
U.S. Emission Measurement Technical Information Center Guidance Document 038 describes a procedure for determining in-stack detection limits.
The equation used for determining in-stack detection limits (ISDL) is:
ISDL = A x B/C
Where A = analytical detection limit; B = amount of analyte; C = volume of stack gas sampled.
For example: The license limit for chromium is 0.03 mg/m3. The ISDL is predetermined to be 0.1 of the license limit, 0.003 mg/m3 (3.0E-6 mg/L). The sample will be prepared in 250 ml volumetric flask and the analysis method has a detection limit of 0.04 mg/L.
(WIP) How Do I Report My Emissions Testing Data?
The emissions testing report format should comply with the National Air Toxics Assessment (NATA) requirements.
In particular, the data should be reported (where relevant) with the analytical result for each parameter determined. The following information is either provided by the person taking the sample or by the laboratory conducting the analysis or monitoring:
ΓùÅ date and time of sampling,
ΓùÅ identification of samples taken, including;
Γùï sample description,
Γùï sample number, and
Γùï unique laboratory number.
ΓùÅ details of any sample preservation,
ΓùÅ reference to analytical method used,
ΓùÅ estimate of the measurement uncertainty for the results,
ΓùÅ date of determination,
ΓùÅ results in the appropriate units,
ΓùÅ notations of any deviation from the standard method, and
ΓùÅ any factor that may have affected reliability of the results.
Furthermore, for emission source testing results, information should be provided on:
ΓùÅ identification of the source tested,
ΓùÅ the location of the sampling plane with respect to the nearest upstream and downstream flow disturbances, and
ΓùÅ details of source operating conditions during sampling.
Abbreviations should be defined and the format of reporting should also meet any requirements specified in the standard method. NATA accreditation now also requires an estimate of the uncertainty of the measurement to be stated. Analysts should not report results to a greater number of significant figures than is justified by the accuracy of the test.
The limit of detection for each analyte should be quoted with quantitative test results. Concentrations below the limit of reporting should be quoted as a ΓÇÿless thanΓÇÖ (<) figure.
For emission monitoring, results are normally reported as g/min for emission discharge rates and mg/m3 or parts per million (ppm) for concentrations.
All volumes and concentrations should normally be reported as:
ΓùÅ dry (except for odor which is normally reported wet),
ΓùÅ at a temperature of 0┬░C, and
ΓùÅ at an absolute pressure of 101.3 kilopascals.
An EPA license may also specify a reference gas level to which a result must be corrected (e.g., 7% oxygen for testing of oxides of nitrogen).
All results should be reviewed on receipt by the person or organization requesting the analysis, and action taken if abnormal or unexpected results are detected.
REPORTING CHECKLIST
Γ¼£ Review data promptly and take any necessary action.
Γ¼£ Advise EPA IMMEDIATELY in writing (by fax) if a result exceeds license conditions.
Γ¼£ Review options for waste minimization.
Γ¼£ License holder to summarize monitoring results, endorse and submit report to EPA regional office.
Γ¼£ Hold all analysis results for three years.
For more information on reporting and record-keeping requirements, visit [hyperlink].
Resource: Information On Various Pollutants
O2 and CO2
Oxygen and carbon dioxide ΓÇô the major constituents in estimating stack gas molecular weight ΓÇô are typically measured using EPA Method 3A. Other non-instrumental methods such as Method 3 or 3B may be used depending on the projectΓÇÖs data objectives and regulatory requirements. Typical analyzer technology includes a paramagnetic analyzer for O2 and a gas filter correlation infrared analyzer for CO2.
SO2
Typical analyzer technology for SO2 using Method 6C includes a pulsed fluorescence analyzer or sometimes an ultraviolet analyzer. For SO2, it is especially important to keep the entire sample at high temperature up to the sample conditioner to avoid moisture condensation. SO2 is especially soluble in water, and any water condensation will result in loss of the SO2 analyte ΓÇô a particular challenge when performing bias checks.
NOX
Typical analyzer technology for NOX using Method 7E includes chemiluminescence analyzer or sometimes an ultraviolet analyzer. In special cases such as the presence of high ammonia concentration, additional measures are necessary. A common approach in such cases is to place an ammonia-scrubbing medium just upstream of the analyzer. Another less common but sometimes useful approach is to use a fourier transform infrared (FTIR) analyzer to identify and measure NO and NO2 separately.
CO
Typical analyzer technology for CO using Method 10 involves an infrared absorption analyzer.
THC
Total hydrocarbons (THC) represent a special category of instrumental measurements. Whereas the instrumental methods discussed above measure a dried sample of stack gas and use three calibration points, EPA Method 25A, the basis of THC measurements, is performed on a wet basis, and uses four calibration points. The standard instrumental technology for THC uses a flame ionization detector (FID), although in some special cases an infrared analyzer is used for high concentrations.
Sometimes hydrocarbon concentration measurements are reported as non-methane hydrocarbons (NMHC), which requires either removing methane from the sample gas or measuring it separately and subtracting it from the hydrocarbon total. This is usually done using chromatography or a catalyst. In a few cases, non-methane, non-ethane hydrocarbon measurements may be required.
VE
Visible emissions using Method 9 is a special case for EPA methods in that the determination is subjective. An observer becomes qualified to perform visible emission evaluations by attending a training class, followed by semiannual field certification against a calibrated transmissometer. The observer records the opacity of a stack plume ΓÇô or the percentage of the visible background that is obscured by the plume.
HCl
Hydrogen chloride and some related halogenated compounds are often measured using EPA Method 26 or 26A. Method 26A is the isokinetic version and a close cousin to Method 5. Method 26 is a non-isokinetic constant-rate variation. In both methods, a sample is drawn through a dilute solution of sulfuric acid, which captures HCl and other halides, while allowing chlorine gas (Cl2) and other halogens to pass through to be captured in the following impingers that contain dilute sodium hydroxide. These solutions are usually analyzed at an off site laboratory by ion chromatography.
Method 320, an FTIR method and some variations of it are often used to measure HCl concentration and in recent years have been mandated by industry-specific EPA rules. These are more advanced methods, but the fundamental concept behind them is that certain compounds have signature infrared absorption patterns that allow them to be identified individually, and the intensity of infrared absorption in those patterns corresponds to the concentrations of these compounds.
PCDD/PCDF
Dioxins and furans ΓÇô polychlorinated dibenzo dioxins and polychlorinated dibenzo furans ΓÇô are sampled using Method 23. This also is a cousin of Method 5. Samples are drawn isokinetically through a nozzle, probe and heated filter as with Method 5, but are then chilled and passed through a sorbent trap before the remaining gas passes through chilled impingers to collect moisture. Laboratory analysis for these compounds is sophisticated, and involves measuring the recovery of surrogate compounds that are spiked onto the sorbent traps before sampling
Product Questions
XD-502 How-To Series
Here is a link to our XD-502 How-To Series playlist if you’d prefer to watch on YouTube directly.
Feel free to check out our YouTube channel as well.
XC-53 How-To Series
Here is a link to our XC-53 How-To Series playlist if you’d prefer to watch on YouTube directly.
Feel free to check out our YouTube channel as well.
XC-623 How-To Series
Here is a link to our XC-623 How-To Series playlist if you’d prefer to watch on YouTube directly.
Feel free to check out our YouTube channel as well.
General How-To Series
Here is a link to our General How-To Series playlist if you’d prefer to watch on YouTube directly.
Feel free to check out our YouTube channel as well.
Novus N1020 Quick Start Guide
How do I audit a transducer?
In this video we show you how to perform a Calibration Check (Audit) on a Transducer that is connected to a Red Lion Process Meter following EPA Method 2 Procedures (a procedure that applies to many isokinetic methods such as Methods 5, 17, 23, 26A, 29, 201A and 202)
Feel free to check out our YouTube channel for more helpful videos.
Contact Apex Instruments if you have any questions.
Isokinetic Method 5 Train Breakdown
Please contact an Apex Instruments Sales Representative if you have any questions.
Sales@apexinst.com
How do I use and program a Fuji Temperature Controller?
If you have any questions, please contact an Apex Instruments Sales Representative.
Sales@apexinst.com
How do I upload firmware to digital metering consoles?
Apex Instruments technician Joe Thompson provides a tutorial on how access and upload firmware to a digital metering console. This procedure is used in E170 electronics package consoles such as the XC-53, XC-170 and XC-623. This procedure does not apply to the XD-502 console.
If you have any questions, please contact an Apex Instruments Sales Representative.
Sales@apexinst.com
How do I change the offset on a digital metering console? When do I need to do that?
Apex Instruments technician Joe Thompson provides a tutorial on recognizing when you would need to offset your TC reading. Joe also goes in to how to change the offset on a digital metering console.
If you have any questions, please contact an Apex Instruments Sales Representative.
Sales@apexinst.com
How do I use an AUX switch on a digital metering console?
Apex Instruments technician Joe Thompson provides a tutorial on how to use the AUX switch on metering consoles.
If you have any questions, please contact an Apex Instruments Sales Representative.
Sales@apexinst.com
How do I use a membrane switch to control the functions on a digital metering console?
Apex Instruments technician Joe Thompson provides a tutorial on how to use a membrane switch to control the functions on a digital metering console.
If you have any questions, please contact an Apex Instruments Sales Representative.
Sales@apexinst.com
What is “Damping” and how is it used in Apex Instruments digital metering consoles?
Apex Instruments technician Joe Thompson provides a demonstration of what damping is and how it is used in our digital metering consoles.
For a tutorial on how to use damping when sampling a stack as well as changing the relevant settings on your digital metering console, please refer to our damping tutorial.
If you have any questions, please contact an Apex Instruments Sales Representative.
Sales@apexinst.com
How do I change units on a digital metering console?
Apex Instruments technician Joe Thompson provides a tutorial on how to change the units on a digital metering console using the user menu.
If you have any questions, please contact an Apex Instruments Sales Representative.
Sales@apexinst.com
How do I use a booster pump?
Apex Instruments technician Joe Thompson provides a tutorial on when it is necessary to use a booster pump and how to use a booster pump with a digital metering console.
If you have any questions, please contact an Apex Instruments Sales Representative.
Sales@apexinst.com
How do I perform a backside leak check on digital Method 5 metering consoles?
Apex Instruments technician Joe Thompson provides a tutorial on how to perform a backside leak check on a digital Method 5 metering console. This procedure is applicable for consoles such as the XD-502 and XC-53.
If you have any questions, please contact an Apex Instruments Sales Representative.
Sales@apexinst.com
How do I use damping when sampling a stack? How do I change damping settings on my digital metering console?
Apex Instruments technician Joe Thompson provides a tutorial on what damping is and how to use it when sampling a stack with a digital metering console. Joe also explains how to change these settings on your console.
For the XD-502, the procedure is covered from 0:00 to 3:56 of this video. For other consoles such as the XC-53, XC-170, and XC-623, the appropriate procedure is covered from 3:56 to 5:57 of this video.
For more information on what damping is, please check out our damping concept guide.
If you have any questions, please contact an Apex Instruments Sales Representative.
Sales@apexinst.com
What is the difference between a coarse and fine valve? How are they used?
Apex Instruments technician Joe Thompson provides a tutorial on how to use the coarse and fine valves on metering consoles.
If you have any questions, please contact an Apex Instruments Sales Representative.
Sales@apexinst.com
How do I input the scaling factor on my Red Lion totalizer?
Apex Instruments technician Joe Thompson provides a tutorial on how to access and input the scaling factor on your Red Lion totalizer.
If you have any questions, please contact an Apex Instruments Sales Representative.
Sales@apexinst.com
Product Feature
Product Feature – XC-5000 AutoKineticΓäó Sampling Console
Our XC-5000 AutoKinetic Series is designed for conducting US EPA Method 5 and associated isokinetic methods. Take the worry out of isokinetic sampling and the human error out of manual data entries and calculations.
The XC-5000 is compatible with your existing Method 5 stack sampling components. Report preparation is streamlined with accurate data that can be downloaded for easy report preparation. The XC-5000 Automated Isokinetic Sampling Console as well as the Model XC-500 Series Sampling System can be used for the following isokinetic test methods and pollutants:
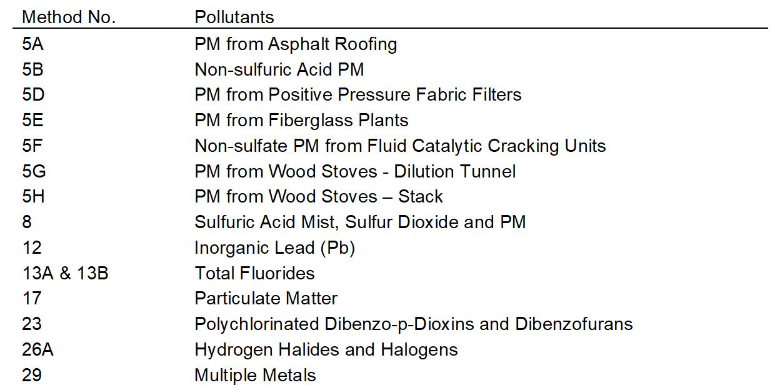
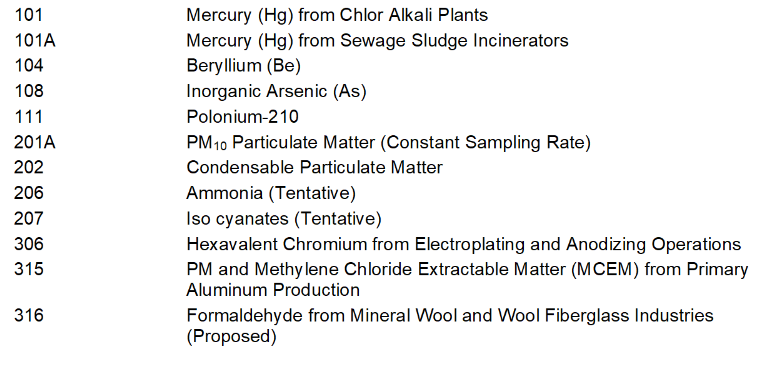
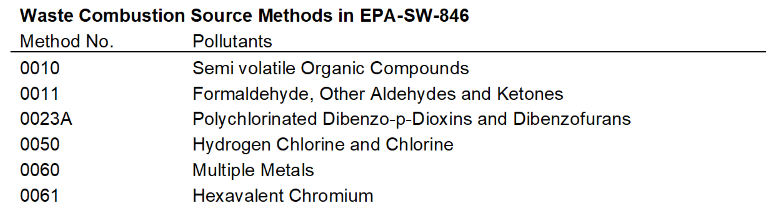
Product Feature – Peak32 Top Tier Technology
Apex Instruments is excited to introduce PEAK32 TOP TIER TECHNOLOGY, a series of advanced metering console series powered by the PIC32 microcontroller module and featuring a sunlight-readable backlit display. Specially reinforced to withstand harsh testing environments, PEAK32 consoles are multifunctional, compact, and cost-effective.

Available models:
ΓùÅ XD-502 (all in one)
ΓùÅ XC-53 (entry-level model)
ΓùÅ XC-623 (for manual sampling)
The XD-502 Gen 2, to be released in 2023, is the latest installation in the Apex Instruments Peak 32 series, powered by the PIC32 microcontroller module and featuring a sunlight-readable backlit display.
This all-in-one digital metering console houses numerous features to increase convenience and efficiency in the same compact, lightweight body as the first generation.
The console allows operators to monitor gas velocity, temperatures, pressures, sample flow rates, and volumes. It can be adapted to other procedures including Methods 2, 4, 17, 23, 26A, 29, 201A, and 202.